
Q3 of 2021 continued to be a busy one for FINTRX and the private capital markets altogether. Throughout July, August, and September 2021, the FINTRX data and research team added and updated hundreds of family office profiles and key contacts within our database. In continuing our mission to provide capital-raising professionals access to unparalleled family office insight, we compiled this report to showcase high-level family office statistics, prominent themes, and further exploration of the private wealth landscape.
Note from our VP of Research
Welcome to our Q3 2021 Family Office Data Report. FINTRX was originally established with the mission of increasing the productivity of asset-raising professionals worldwide. Since 2014, we have remained dedicated to this mission by providing reliable, comprehensive research and analytics surrounding the private wealth industry. Our product and data offering continues to improve, helping solve the complex issues industry professionals face daily.
Our research team remains dedicated and forward-thinking, continuously striving to enhance the breadth and depth of our data. We aim to enhance our clients' outreach process through credible research and analytics and innovative technology.
Introduction
Despite changing market landscapes, family offices continue to grow on several levels, including assets under management, direct transactions, co-investment opportunities, and the number of family offices created - both in the United States and worldwide. This report has been produced exclusively using our expansive family office data and research platform. Thanks to our dedicated research team - who updates and expands our vast data set daily - we can share high-level information regarding family offices and the private wealth ecosystem at large. This cross-section of our complete data set provides an accurate representation of the family office growth that took place throughout Q3 of 2021.
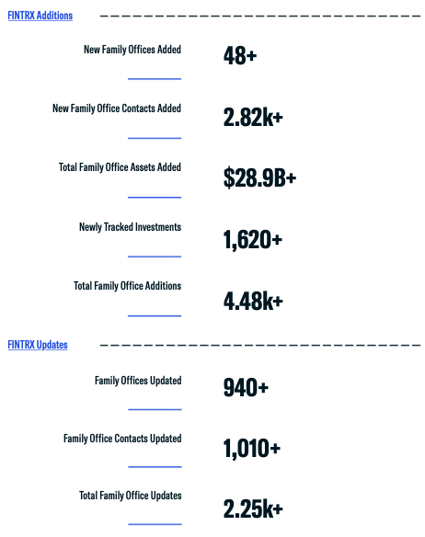
From July to September, our research team made 2,250+ updates and 4,480+ additions to our dataset including the addition of 48 new family offices, over 2,820+ family office contacts, and more than 1,620+ tracked investments throughout the quarter.
Q3 Data Overview: Monthly Data Breakdown
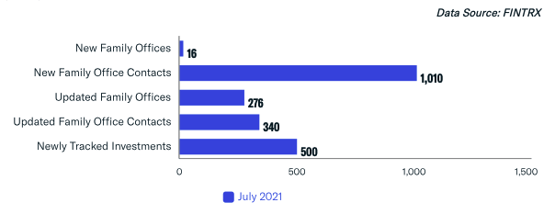
July Family Office Platform Updates & Additions
Throughout the month of July, our research team added 16 new family offices, 1,010 new family office contacts, and 500 newly tracked investments to our dataset. We made 600+ updates, including 276 family office entities and 340 family office contacts.
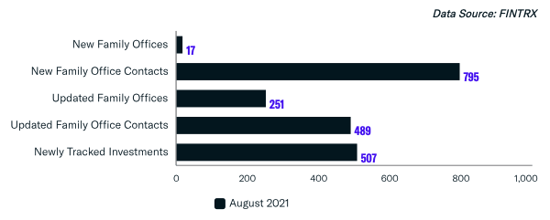
August Family Office Platform Updates & Additions
Throughout August, our research team added over 1,300+ new data points, including the addition of 17 new family offices, 795 new family office contacts, and 500+ newly tracked family office investments. Over 700+ updates were made, including 251 updated family office entities and nearly 500 updated contacts.
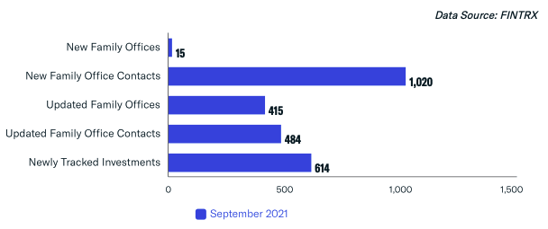
September Family Office Platform Updates & Additions
Throughout the month of September, our research team made over 1,600+ additions to our dataset, including the addition of 15 new family offices, 1,020 new family office contacts, and 600+ newly tracked investments. We made 900+ updates, including 415 updated family offices and nearly 500 updated family office contacts.
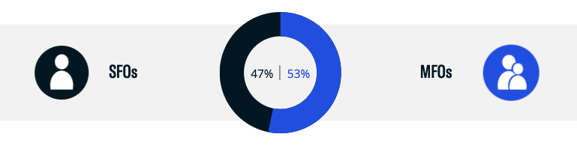
Single-Family Office vs Multi-Family Office Breakdown
Origin of Wealth: Top Sectors
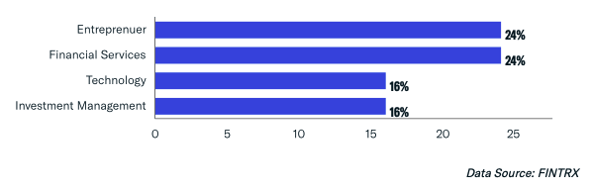
While several variables play a role in the investments family office entities make, a more prevalent pattern explained by our research is often the connection between the industry of wealth origin and the industry of investment interest, as they often have more knowledge in that specific field. As seen in the chart here, a majority of newly added family offices created their wealth either as entrepreneurs or in the financial services, technology, and investment management landscapes.
Asset Class Interest Breakdown
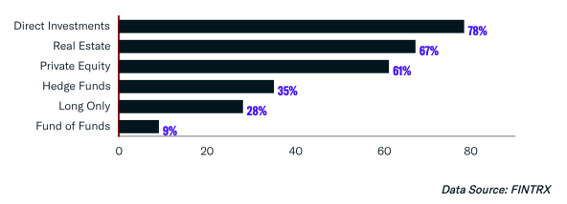
Family offices often invest with two strategies in mind, wealth preservation and asset growth. Alternative asset classes often allow for both. Below, we outline alternative asset classes of interest for this subset. A majority of new family offices added to the FINTRX platform throughout July, August, and September show a large tendency to make direct investments, with 78% of family offices choosing the direct route. Real estate and private equity followed, at 67% and 61%, respectively.
Assets Under Management Breakdown
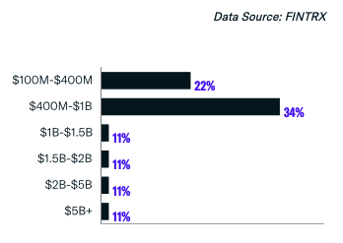
Here, we outline the assets under management (AUM) breakdown of new family offices added to our dataset throughout Q3.
The most prevalent among this sample size are those with AUM between $400M-$1B at 34%, followed by those with AUM between $100M-$400M, at 22%.
The following AUM ranges make up the remaining 44%, with each at 11%, respectively.
Direct Transactions
Direct investments allow the family office to focus on buying companies of a preferred size or industry, ultimately ensuring greater control of their capital. Finding a suitable deal takes an extensive network with key relationships. Because family offices often specialize in a single industry or sector, they often have the knowledge and resources needed to ensure success.
Top 6 Sectors of Interest
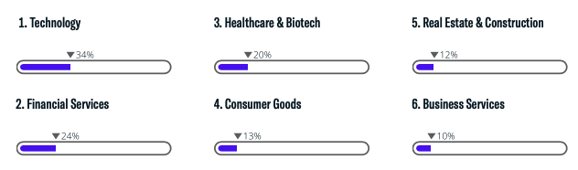
As outlined, 34% of newly added family offices made direct investments in privately held tech companies. Other sectors of interest for this subset include financial services at 24% and healthcare & biotechnology at 20%.
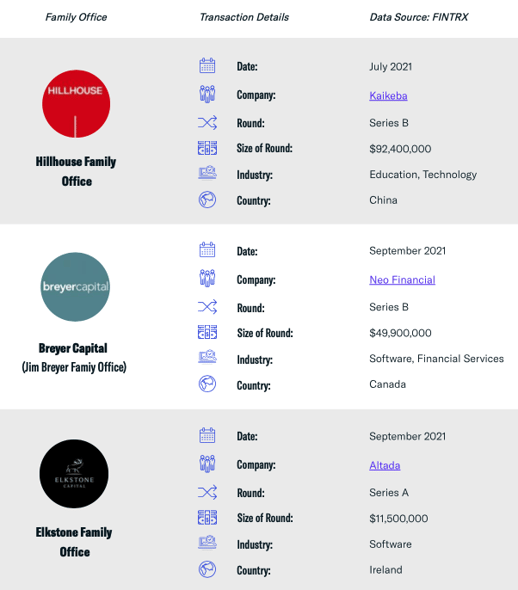
Key Family Office Transactions Throughout Q3
Below, we highlight key transactions of family offices that took place throughout Q3. Below, you can see the family office making the transaction, the month and year when the transaction took place, the funding round, the size of the round, the funded company, and further details on the company itself.
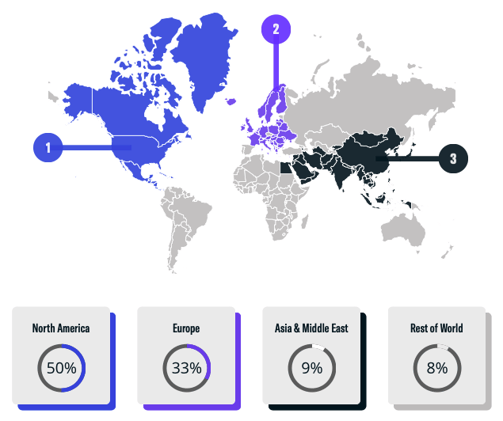
Regional Family Office Breakdown
Below, we provide a regional breakdown of the new family offices added to our dataset between July and September 2021. Throughout these months, 50% of newly added private wealth vehicles are domiciled in North America. Europe followed at 33%, while Asia and the Middle East made up 9%, collectively.
 Top Regions with New Family Office Activity:
- North America: 50%
- Europe: 33%
- Asia & Middle East: 9%
- Rest of World: 8%
Conclusion
Q3 continued to exhibit healthy growth across the FINTRX data set and the family office landscape. As outlined, our private wealth insights have grown to include an extensive analysis of 3,090+ family offices globally and 15,800+ decision-making individuals that work within them.
Throughout our research, we continued to observe family offices harnessing direct investment opportunities. Direct investments are often an optimal route for family offices as the direct route allows the family office to focus on buying companies of a preferred size or industry, ultimately ensuring greater control of their capital. Technology remained the leading industry for family offices going direct, with nearly 200 transactions made into private tech companies throughout the quarter.
Our data team added approximately $28.9B+ of family office assets under management throughout our dataset. Through our continued expansion of strategic partnerships, private sourcing methods, and public aggregation, FINTRX ensures credible family office intel to our global client base.
Download Your Copy

FINTRX provides comprehensive data intelligence on 850,000+ family office & investment advisor records, each designed to help you identify, access, and map the private wealth ecosystem. Explore in-depth dossiers on each family office and investment advisor. Access AUM, source of wealth, investment criteria, previous investment history, sectors & industries of interest, and advisor growth signals amongst other key data points.
Additionally, FINTRX provides insight and expansive contact information on 850,000+ decision-makers, featuring job titles, direct email addresses, phone numbers, common connections, alma maters, past employment history, brief bios & much more.
For an in-depth exploration of the FINTRX family office platform, request a demo below.


Copyright © 2026 FINTRX, Inc. All Rights Reserved. 18 Shipyard Drive Suite 2C Hingham, MA 02043 Data Privacy Policy
.png?width=367&height=109&name=ezgif.com-gif-maker%20(3).png)