
FINTRX kicked off the first half of 2021 by adding and updating thousands of family office profiles and key contacts within our family office database. In continuing our mission to provide capital-raising professionals access to unparalleled family office data, we have constructed this report to showcase notable family office statistics, prominent themes, further exploration of the alternative wealth landscape, and projections for the months ahead.
Message from our VP of Research
Welcome to our First Half of the 2021 Family Office Data Report. In an effort to speed up the production of asset-raising professionals worldwide, the FINTRX family office data and research platform offer in-depth private wealth intel designed to solve the complex issues industry professionals face daily. Our team members remain dedicated, forward-thinking, and continuously striving to enhance the breadth and depth of our data. We aim to enhance our clients' outreach process through credible research and cutting-edge technology. Thank you for taking the time to read through our First Half of 2021 Report and we look forward to a potential engagement with you and your team.
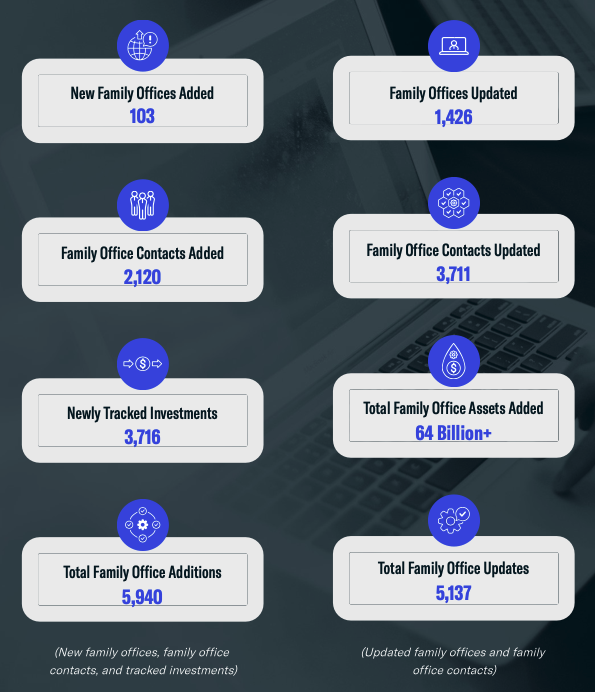
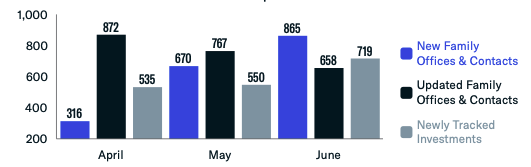
"From January to June, our research team made 5,137 updates to our data set, including the addition of 103 new family offices, 2,120 new family office contacts, and over 3,700+ tracked investments." - Dennis Caulfield, Vice President of Research at FINTRX
Introduction
Despite changing market landscapes, family offices have continued to grow on a number of levels, including assets under management, direct transactions, co-investment opportunities, and the number of family offices - both in the United States and globally. Uniquely, all data in this report (unless otherwise cited) has been built bottom-up from our vast dataset, rather than based on models, outsourced data, or small-sample survey data.
Since our founding in 2014, FINTRX has compiled over a million data points on 3,050+ single and multi-family offices worldwide, with credible insights on the nearly 15,000 contacts working within them. As a result, we can share high-level intel into this hard-to-reach, yet economically significant, sector. Continue reading for a closer look at how quarters one and two of 2021 unfolded within our rapidly growing family office ecosystem.
Q1 Family Office Data Highlights: January - June 2021
Q1 Family Office Data Highlights: January - March 2021
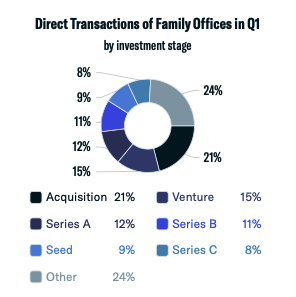
A majority of family office transactions that occurred in Q1 did so through early rounds of funding or via co-investment opportunities, with 21% of family offices taking part in acquisitions.
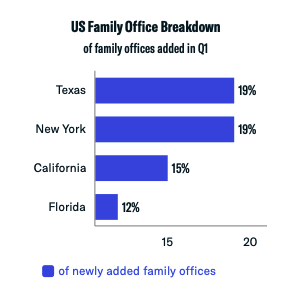
Throughout January, February, and March, our analysis showed Texas, New York, California, and Florida as having the most number of family office additions.
Q2 Family Office Data Highlights: April - June 2021
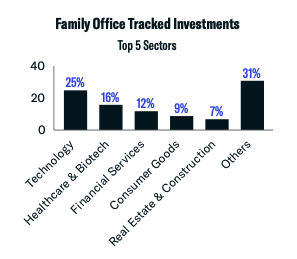
Direct investments are a viable option for family offices because of the increased transparency and control it allows for the families themselves. As outlined, 25% of newly added family offices (between April and June) made direct investments in privately held tech companies. Other sectors of interest for this subset include healthcare & biotechnology at 16% and financial services at 12%.
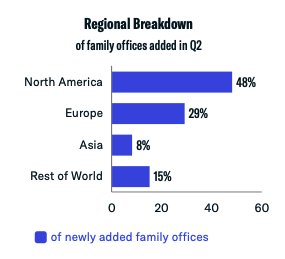
Due to the unequal distribution of global wealth over the past decade or so (and many other factors), the alternative wealth space has experienced a dramatic rise in family office activity across the globe. For newly added family offices between April and June, 48% are based in North America, 29% are in Europe, and 8% are headquartered in Asia. The rest of the world makes up the remaining 15%.
Q1 & Q2 Family Office Data Breakdown
Oftentimes, we see family offices shifting their asset class interest as a means to diversify or strengthen their investment portfolio. The most popular asset class for family offices added throughout the first half of the year is real estate at 81% and private equity at 76%.
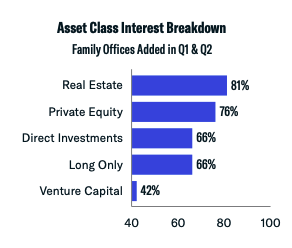
Additionally, 66% of family offices showed an interest in direct and long-only investments. Investing in different asset classes ensures a certain level of diversity. Diversification reduces risk and increases your probability of making a return.
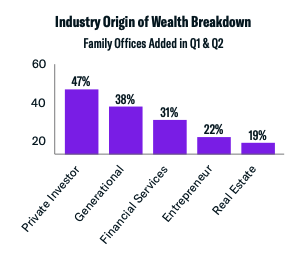
One of the more prevalent family office investment patterns is the connection between the industry of wealth origin and the industry of investment interest. As outlined above, 47% of newly added family offices created their wealth through private investments. Generational wealth followed at 38%.
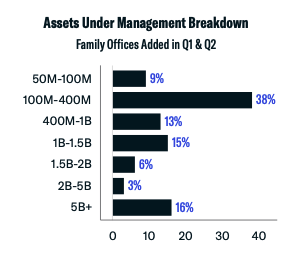
Throughout the first half of the year, 38% of newly added family offices have an AUM between $100M and $400M.
Regional Breakdown: Q1 & Q2 Data
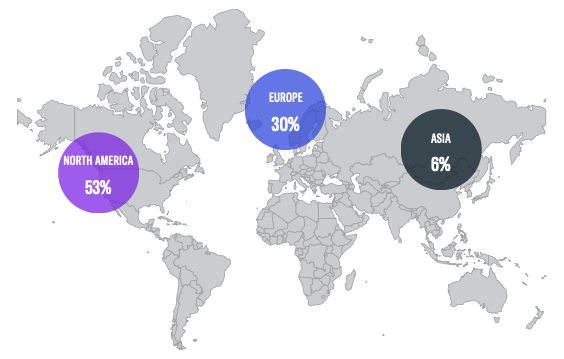
Of the family offices added to the FINTRX platform between January and June, 53% are based in North America, while 30% are domiciled in Europe, and 6% in Asia. The rest of the world makes up the remaining 11%. With an estimated 35-40% of the world's billionaires and ultra-wealthy, it's no surprise North America leads the world in family office activity. That said, the steepest rate of growth within the family office landscape is outside North America, as they typically become the investment of choice for the world's wealthiest families and individuals.
Additional Family Office Data Highlights from Q1 & Q2
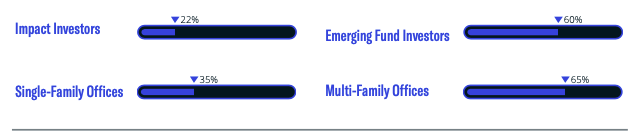
In regards to new family offices added in Q1 and Q2, 65% are multi-family offices while 35% are single-family offices. 22% of newly added family offices are impact investors, and 60% are emerging fund investors.
Direct Transactions: Q1 & Q2 Breakdown
Throughout Q1 and Q2, our analysis indicated 38% of family offices that made direct transactions did so into companies with 25-100 employees. Firms with 1-25 individuals followed at 28%.
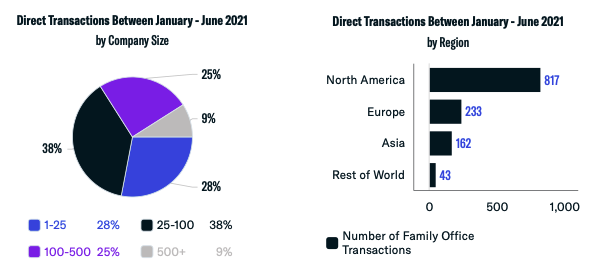
A majority of family offices that made direct transactions in the first half of the year did so into North American and European companies, with more than 1,050+ direct transactions combined.
Conclusion
The first half of 2021 has exhibited healthy growth throughout the FINTRX data set and the family office landscape as a whole. As outlined in this report, our private wealth insights have grown to include extensive analysis on 3,050+ family offices globally and 14,300+ decision-making individuals that work within them. Throughout our research, we continued to observe family offices harnessing direct investment opportunities. We believe this results from investors wanting greater control, lower fees, and increased transparency.
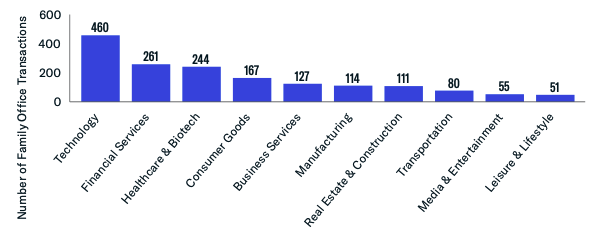
In Q1 and Q2, technology remained the leading industry for family offices going direct, with nearly 500 transactions made into private tech companies. Direct investments allow the family office to focus on buying companies of a preferred size or industry, ultimately ensuring greater control of their capital. Finding the right deals takes an extensive network with strong relationships. Because family offices often specialize in a single industry or sector, they have the knowledge and resources needed to be successful.
Thanks to our dedicated research team, FINTRX was able to track over $64 billion of family office assets under management during the first half of 2021. Although we are proud of the monumental strides that have been made so far, we remain determined to build on this momentum. Through the continued expansion of strategic partnerships, private sourcing methods, and public aggregation, we ensure credible family office intel to our global client base.
Download the 12-Page Report

With complete coverage of over 3,090+ family offices, 15,800+ family office contacts, and 19,600+ tracked investments, FINTRX ensures direct access to accredited investor intelligence. The FINTRX platform is an essential tool in understanding the family office landscape in the U.S. and abroad, while also empowering users to uncover commonalities with these family offices for effective, personal outreach.
For an in-depth exploration of the FINTRX family office platform, request a demo below.


Copyright © 2026 FINTRX, Inc. All Rights Reserved. 18 Shipyard Drive Suite 2C Hingham, MA 02043 Data Privacy Policy
.png?width=367&height=109&name=ezgif.com-gif-maker%20(3).png)