
In an effort to provide valuable insight into the private wealth and financial services industry, FINTRX is pleased to present the 2023 Registered Investment Advisor (RIA) Regional Analysis. In this report, we break down the RIA landscape by geographical region, with data on firm and managed asset distribution, accounts, employees, and more by both global region and U.S. region. All data found within this report is derived from the FINTRX Registered Investment Advisor (RIA) & Broker Dealer platform and is inclusive of firms registered as investment advisors as well as dually registered as IA and broker dealer.
2023 FINTRX RIA Regional Analysis
Download the Report


Introduction
The large majority of RIAs are located in the United States, accounting for over 96% of firms and 90% of global managed assets. Since by definition, an RIA is an investment advisory firm that is registered with the Securities Exchange Commission or State Securities Authorities (both U.S. regulatory bodies), the term almost always refers to a US-based firm. However, an increasing number of advisors are finding that opportunities can be ripe in other parts of the world.
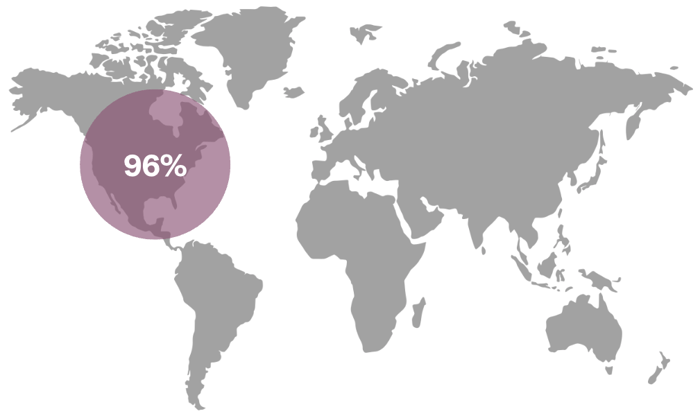
- - Percentage of RIA firms located in the United States: 96%
RIAs Broken Down by United States Region
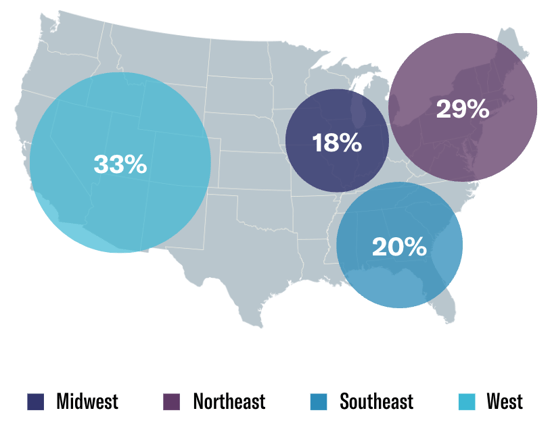
Here, we explore the distribution of RIA firms and managed assets across the United States. The West is home to the majority of investment advisor entities, with 33% of US-based firms, however the Northeast region holds most of the country’s capital, accounting for roughly 61% of total AUM.
Breakdown of U.S. Regions by Number of Firms
-
- - Midwest: 18%
- - Northeast: 29%
- - Southeast: 20%
- - West: 33%
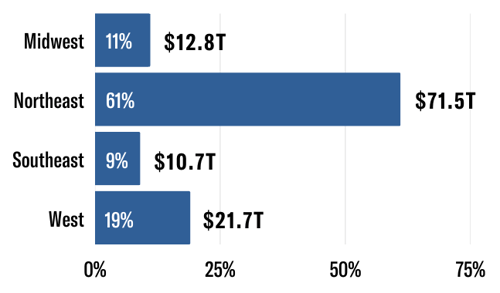
Assets Under Management (AUM) Breakdown of RIAs
AUM refers to the total value of assets that a firm manages on behalf of its clients. Here, we provide a break down of asset distribution across U.S. regions.
Total Assets Under Management
-
- - Midwest: $12.8 Trillion (11%)
- - Northeast: $71.5 Trillion (61%)
- - Southeast: $10.7 Trillion (9%)
- - West: $21.7 Trillion (19%)
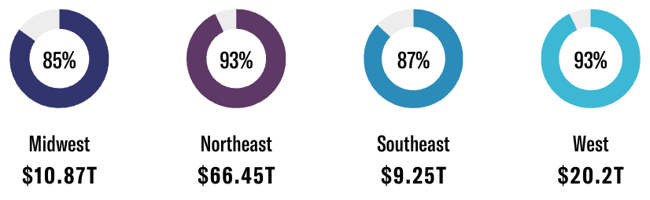
Discretionary Assets Under Management
-
- - Midwest: $10.87 Trillion (85%)
- - Northeast: $66.45 Trillion (93%)
- - Southeast: $9.25 Trillion (87%)
- - West: $20.2 Trillion (93%)
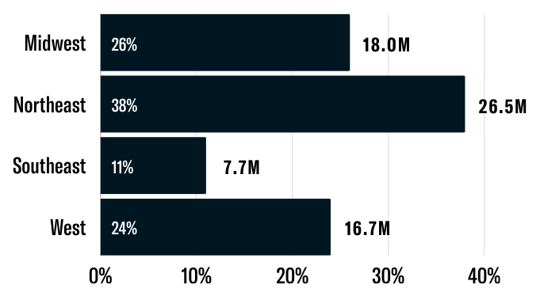
RIA Account Breakdown
Below is an analysis of RIA accounts by U.S. region, including the number of accounts managed & the percentage of accounts that are managed on a discretionary basis.
Total Number of Managed Accounts
-
- - Midwest: 18.0 Million (26%)
- - Northeast: 26.5 Million (38%)
- - Southeast: 7.7 Million (11%)
- - West: 16.7 Million (24%)
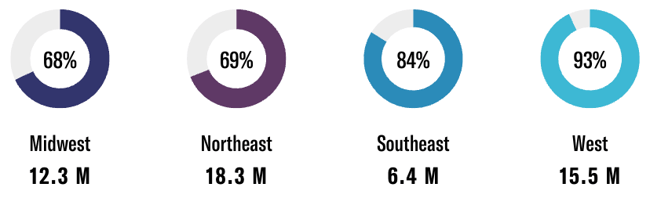
Discretionary Accounts
-
- - Midwest: 68%
- - Northeast: 69%
- - Southeast: 84%
- - West: 93%
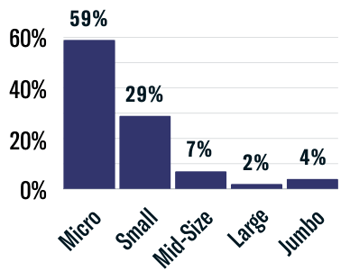
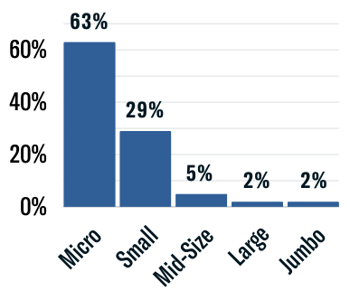
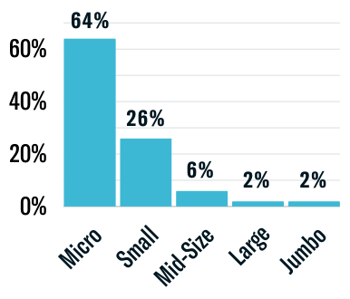
RIA Firm Size by Employee Count Breakdown
Here, we explore the size distribution of RIA firms in each region based on count of employees. Firms are grouped into five size cohorts: Micro (1-5), Small (5-25), Mid-size (25-75), Large (75-150), and Jumbo (150+). Across the U.S., the large majority of RIAs employ fewer than five people.
Midwest
-
- - Micro: 59%
- - Small: 29%
- - Mid-Size: 7%
- - Large: 2%
- - Jumbo: 4%
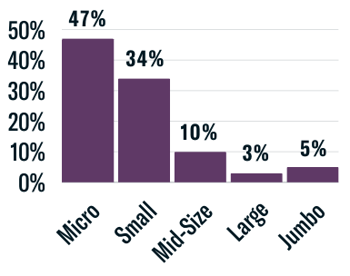
Northeast
-
- - Micro: 47%
- - Small: 34%
- - Mid-Size: 10%
- - Large: 3%
- - Jumbo: 5%
Southeast
-
- - Micro: 63%
- - Small: 29%
- - Mid-Size: 5%
- - Large: 2%
- - Jumbo: 2%
West
-
- - Micro: 64%
- - Small: 26%
- - Mid-Size: 6%
- - Large: 2%
- - Jumbo: 2%
Global Breakdown of RIAs
Below is a breakdown of RIAs by global region for both total number of registered firms and total assets under management (AUM). While these entities are mostly found within North America, it’s important to note that other regions, namely Europe and Asia, represent more than $10 trillion of RIA-managed capital.
Percentage of RIAs Located in North America
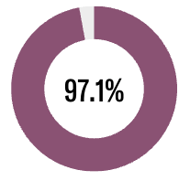
- - Percent of Global Total: 97.1%
Regional Breakdown by Total Number of Firms (Excluding North America)
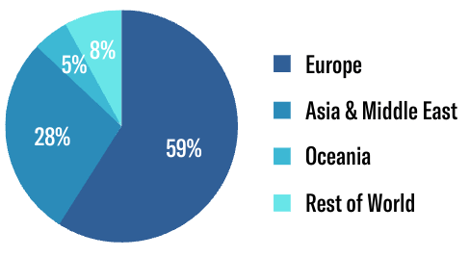
- - Europe: 59%
- - Asia & Middle East: 28%
- - Oceania: 5%
- - Rest of World: 8%
Total Assets Under Management Breakdown
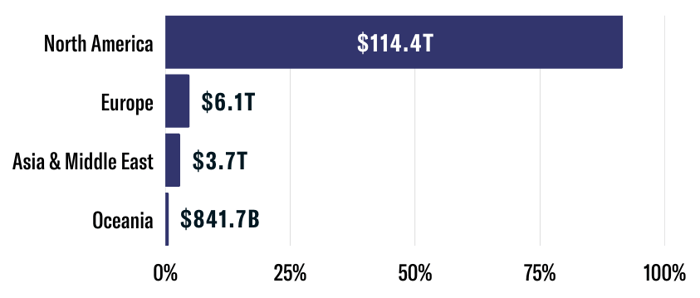
- - North America: $114.4 Trillion
- - Europe: $6.1 Trillion
- - Asia & Middle East: $3.7 Trillion
- - Oceania: $841.7 Billion
About FINTRX
FINTRX is a unified data & research platform providing comprehensive data intelligence on 850,000+ family office & investment advisor records, each designed to help asset-raising professionals identify, access & map the global private wealth ecosystem. FINTRX data intelligence covers nearly 4,000+ family offices, 20,000+ family office contacts, 40,000+ registered investment advisor entities, and 746,000+ registered reps. Data for every record within FINTRX is pooled from 10+ public & private sources.

Equipped with 375+ search filters and numerous customization options, FINTRX allows you to seamlessly track where family office & investment advisor capital is flowing, uncover allocation trends, break down investments by sector & size, understand future investment plans and much more.


Copyright © 2026 FINTRX, Inc. All Rights Reserved. 18 Shipyard Drive Suite 2C Hingham, MA 02043 Data Privacy Policy
.png?width=367&height=109&name=ezgif.com-gif-maker%20(3).png)