
As the leading private wealth data intelligence solution, FINTRX is pleased to present the highly anticipated 2023 FINTRX Private Wealth Data Report, a game-changing resource that delves deep into the ever-evolving landscape of family offices and registered investment advisors (RIAs). With data compiled using the FINTRX Family Office & RIA Data Platform, this report offers a thorough analysis of the private wealth landscape, including data-driven insights on the family office and registered investment advisor ecosystems as well as an overview of all FINTRX platform updates and additions made throughout the year.
Download the Report


Introduction
Welcome to the 2023 FINTRX Private Wealth Data Report: a high-level compilation of the global family office and registered investment advisor (RIA) landscapes and trends throughout the year with data compiled using FINTRX Private Wealth Data Intelligence. As the leading provider of family office and registered investment advisor industry intelligence, FINTRX is committed to delivering the most comprehensive and accurate data available in the market. As these private wealth vehicles continue to gain traction, we empower individuals to connect with investors, identify suitable opportunities and ultimately navigate the private wealth ecosystem with confidence.
Our dedicated team of 75+ researchers works tirelessly to compile and verify data from proprietary research, data partnerships and advanced algorithms. Our dedication to data integrity allows asset-raising professionals to thrive in fluctuating conditions. We hope the data and perspectives contained within this report will empower you to make informed decisions as you navigate the intricate ecosystem of private wealth management.
Note From Our VP of Research
Dear Reader,
As the VP of Research at FINTRX, I am thrilled to share with you our highly anticipated 2023 Family Office and RIA Data Report. This most recent edition of our annual series offers an extensive overview of family office and registered investment advisor data, meticulously collected over the last year by the FINTRX Data and Research Team.
At FINTRX, we remain committed to arming asset-raising and financial professionals with the pinnacle of data intelligence surrounding the private wealth landscape. This comprehensive report offers a deep dive into the evolving landscape of the private wealth market, providing valuable insights and trends that will empower you to make informed decisions and seize new opportunities.
I would like to extend my appreciation to our valued clients for continuing to trust our team to be the provider of your family office and investment advisor research and data. We value your partnership above all else.
If you have questions regarding the data or would like to discuss the report further, please do not hesitate to reach out to our team. Our goal, as always, is to support your success in navigating the rapidly evolving private wealth ecosystem.
Thank you for taking the time to read our report.
Warm Regards,
Dennis Caulfield, Vice President of Research
2023 Family Office Data
Family Office Platform Updates & Additions
Throughout the past year, the persistent efforts of our data and research team have led to substantial updates and enhancements to our family office dataset. The updated totals are listed below. It's important to note that our full family office dataset consists of nearly 4,000 family offices and 21,000+ family office contacts. Learn more about our family office dataset here.
- New Family Offices: 590+
- New Family Office Contacts: 4,300+
- Tracked Investments Added: 4,700+
- Total Family Office Additions: 9,590+
- Total Family Office Assets Added: $677.43 Billion+
- Family Office Firm Updates: 3,770+
- Family Office Contact Updates: 17,870+
- Total Family Office Updates: 21,640+
Total Family Office Updates & Additions Made in 2023: 31,230+
Family Office Breakdown
Single Family Offices vs Multi-Family Offices
Single family offices (SFOs) are private wealth management firms created by high-net-worth individuals and families that are designed to provide completely customized and unique financial and investment services for that family. Multi-family offices (MFOs) provide similar services to a group of clients, using shared resources to streamline costs and provide a more standardized approach to wealth management.
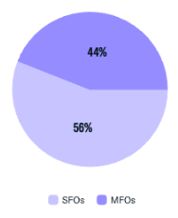
Of the single and multi-family offices added to our family office dataset in 2023, 56% are SFOs while the remaining 44% are MFOs.
Single Family Office Wealth Origin Analysis
Historically, there has been a strong correlation between the industry from which a family office's wealth originates and the industries of interest for potential investment activity. This can be attributed to the individual or family's unique expertise in that particular industry and a desire for continued involvement in an industry that has driven their past success.
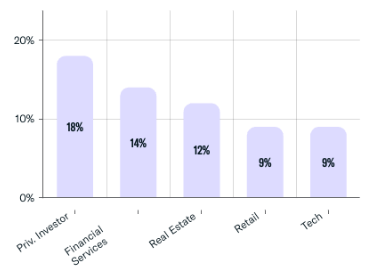
The majority of single family offices generated their wealth through private investments, showcasing their expertise in navigating the private wealth landscape.
Geographic Breakdown
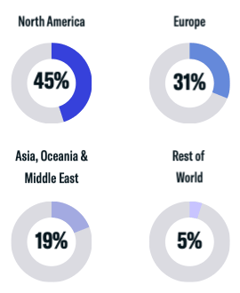
We continue to see a significant concentration of family offices in North America and Europe, whose numbers account for 76% of the family offices added in 2023. This trend underscores the enduring prominence of these regions in the family office landscape.
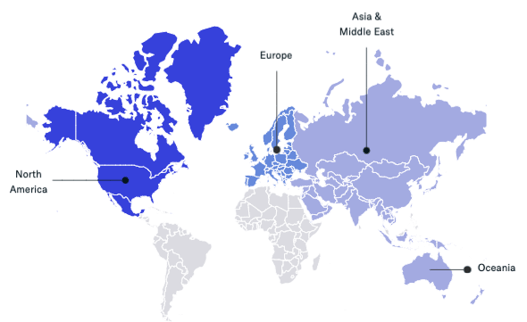
Moreover, Asia, the Middle East and the Oceania region have all experienced a noteworthy increase in the number of family offices, together contributing 19% to the total new firms established in 2023. This growth highlights the expanding influence of these areas in the global family office sector, indicating a shift towards a more geographically diverse family office landscape.
Assets Under Management (AUM)
Assets under management (AUM) represent the total market value of the assets a family office administers for its clients. These assets encompass a diverse range, including stocks, real estate, private equity, hedge funds, and other alternative investments. The AUM of family offices can differ significantly, influenced by factors such as the number of families they represent and the combined net worth of these clients.
The graph below displays the AUM ranges (in USD) for family offices added in 2023. The majority of firms added manage between $100M and $400M in assets, accounting for 30% of firms.
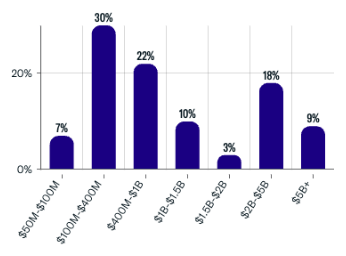
Total Family Office Assets Added to FINTRX in 2023: $677.43 Billion
Asset Class Interest
Family offices typically show a strong inclination towards investing in an array of asset classes. Investing in alternative assets offers an effective strategy for diversifying portfolios and acts as a crucial counterweight to conventional investments. This approach provides a degree of protection against economic downturns.
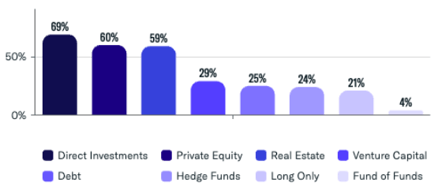
In 2023, family offices increasingly concentrated on direct investments in private companies, which constituted 69% of their investment focus. Private equity followed closely, representing 60% of their investments.
Family Office Direct Investments by Sector
Family offices often choose direct investments, aiming for greater control over asset allocation and a more active role in the business operations of their investment ventures. Even amid the volatile markets of 2023, family offices continued to make direct investments as a strategy for portfolio diversification, frequently employing innovative approaches to overcome challenges and attain success. The following graph illustrates the top ten sectors where family offices directed their investments in 2023.
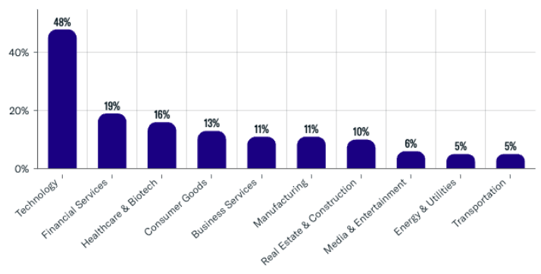
Technology remained the leading industry for direct family office investments, making up 45% of tracked transactions throughout the year. This translated to 2,230+ transactions made into private technology companies. As technological innovation drives the global economy, we will continue to see substantial private capital flow into emerging tech companies in 2024. 2023 also saw an interest in financial services and healthcare & biotech. Despite shifts in investment trends quarter over quarter, the top ten sectors often remain the same over the long term.
Total Family Office Direct Investments Tracked in 2023: 4,700+
2023 Registered Investment Advisor (RIA) Data
RIA Overview
A Registered Investment Advisor (RIA) is either an individual or a firm that has registration with the SEC or State Securities Authorities. Their primary role is to advise or manage investments for individuals or institutions, adhering to a fiduciary standard that mandates acting in the client's best interests.
The designation 'RIA' encompasses a broad range of entities, including banks, hedge funds, and traditional wealth managers. However, in this report, we exclude data pertaining to firms that are solely registered as broker-dealers. There has been a noticeable increase in the demand for RIA services, driven by the growth in global wealth and persistent economic fluctuations. More and more, both individuals and institutions are turning to these advisors for help in managing their funds, seeking expert guidance to navigate the increasingly complex investment environment of today.
FINTRX RIA Data Coverage
FINTRX's Registered Investment Advisor (RIA) & Broker Dealer data platform encompasses a comprehensive database of nearly 40,000 registered entities. This includes over 32,700 RIA firms and more than 850,000 representatives. The platform offers extensive data on various aspects such as investment trends, assets under management (AUM) and accounts, private funds, and additional relevant financial information. Moreover, it provides insights into market dynamics, client demographics and regional investment patterns, making it a valuable resource for industry analysis and strategic planning.
Total RIA Firms (including firms dually registered as RIAs & broker dealers): 32,700+
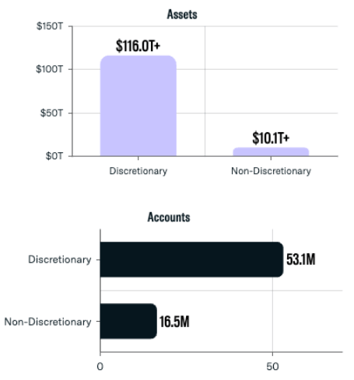
Assets Under Management (AUM) & Accounts
In this section, we offer an analysis of the distribution of assets and accounts managed on a discretionary vs. non-discretionary basis. Our data reveals that a significant 92% of assets fell under discretionary management, wherein advisors can make investment and allocation decisions for their clients autonomously, without requiring approval for each transaction. In contrast, only 8%, of client assets were managed on a non-discretionary basis, where advisors provide recommendations, but the final decision-making power rests with the clients.
-
Total AUM (including firms dually registered as RIAs & broker dealers): $126 Trillion+
-
RIA Total AUM: $118 Trillion+
-
Total Accounts: 69.8 Million+
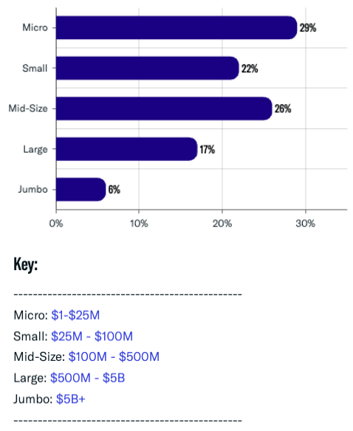
Firm Size by Assets
Here we provide a breakdown of RIA firms based on their total assets under management (AUM) in 2023. FINTRX data found that nearly 30% of the registered entities managed assets under $25 million. Additionally, a notable 26% of registered firms handled a significantly larger amount, with assets ranging between $100 million and $500 million.
Fee Structures
RIAs utilize various fee frameworks that align with the services they provide and the type of clients they serve. The most prevalent fee structures typically involve a combination of assets under management (AUM) percentage, fixed rates, or hourly charges.
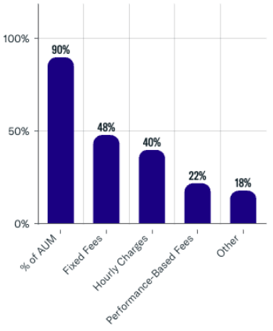
In 2023, the primary fee structure utilized by firms remained a percentage of managed assets, with 90% of firms employing this approach. Following the predominant fee structure of a percentage of managed assets, fixed fees were the second most common, used by 48% of firms. Hourly rates were employed by 40% of firms, and performance-based fees were utilized by 22% of firms.
Firm Classifications
Firm classifications refer to the categorization of RIA and Broker Dealer firms based on their business activities. Each firm can be assigned one or more classifications based on the services they provide. For example, a firm may be classified as a Hedge Fund, or Investment Bank, among others. By understanding the classifications of other firms, users can assess the landscape and identify opportunities for collaboration or differentiation.
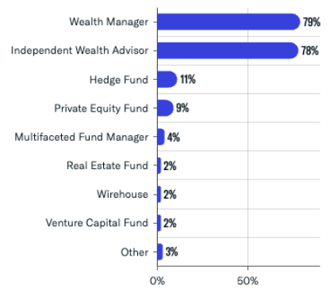
Over the course of the year, a significant proportion of firms, nearly 80%, were classified as Wealth Managers or Independent Wealth Advisors.
Alternative Investments
Integrating alternative investments into client portfolios is a widespread approach used by RIAs to diversify holdings, reduce risk, and aim for potentially greater returns than traditional investments. Such alternative assets usually have a low correlation with the stock market, aiding in decreasing exposure to market volatility and fluctuations. The graph below illustrates a breakdown of the top ten alternative investments popular among RIAs in 2023. Notably, a significant portion of entities are predominantly engaged in real estate investments.
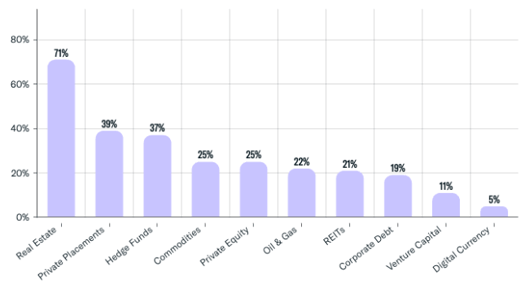
Total Firms Active in Alternatives: 25,400+
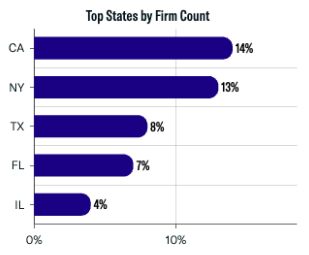
Geographic Breakdown
Registered investment advisors often establish their headquarters in or around key urban areas across the United States. The chart below highlights the top states both in terms of the total value of assets managed and the number of firms based there. New York and California stand out as the leading hotspots for RIAs, mirroring their status as the country's most prosperous and densely inhabited metropolitan areas.
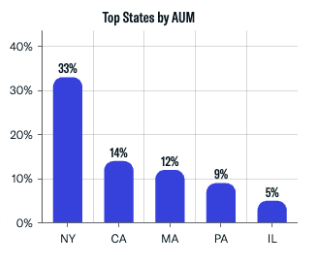
The United States holds a dominant position in the global RIA market, accounting for approximately 70% of all registered firms and a staggering 90% of the worldwide RIA assets, amounting to roughly $113.8 trillion. This underlines the pivotal role of the U.S. in shaping the RIA landscape and indicates the country's substantial influence on global investment strategies and trends.
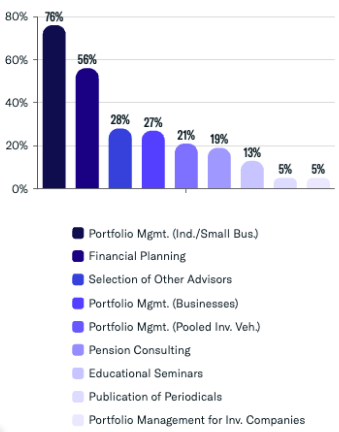
Services Provided
RIAs offer their clients a diverse range of services, encompassing portfolio management, financial planning and tax management, among others. The graph below illustrates the prevalent services provided by RIAs throughout 2023. Portfolio management for individuals and small businesses remained the leading service, accounting for roughly 76% of firms. This was followed by financial planning services, utilized by 56% of advisors.
Other Business Activities
'Other Business Activities' refers to the additional services or activities that RIAs offer beyond their primary focus. This information is particularly relevant when seeking to form strategic partnerships, target specific niches or diversify investment portfolios.
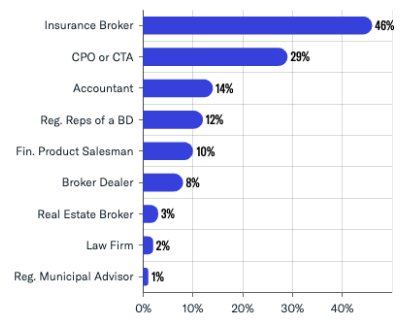
Our research indicates that 46% of RIAs also act as insurance brokers, and nearly 30% double as commodity pool operators (CPOs) or commodity trading advisors (CTAs). By leveraging this data, users can identify RIAs that not only manage assets but also provide specialized services.
Separately Managed Account (SMA) Asset Allocation
Separately Managed Account (SMA) asset allocation refers to the distribution of assets held on behalf of clients, excluding other investment companies, business development companies and pooled investment vehicles. SMAs consist of different asset types, with exchange-traded equities (stocks and ETFs) and cash or cash equivalents being the most common. SMAs provide flexibility and customization in investment strategies, which may result in higher management fees.
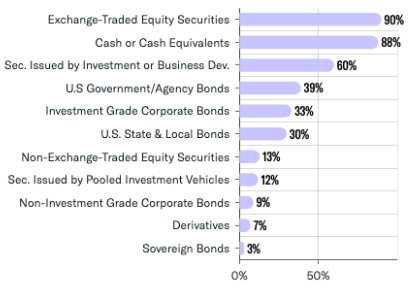
Throughout 2023, 90% of RIAs utilized exchange-traded securities and 87% maintained cash or cash equivalents. The other most commonly utilized SMA assets throughout the quarter included securities issued by investment or business development companies, U.S. government agency bonds, and investment-grade corporate bonds.
FINTRX Private Wealth Market Intelligence
FINTRX is a unified data and research platform, offering extensive data intelligence on 850,000 family office and investment advisor records, designed to enhance industry professionals' ability to access, map and engage with the global private wealth ecosystem by providing comprehensive and updated information on family offices, registered investment advisors and other vital entities in the space.
With an extensive database of nearly 4,000 family offices, 20,000 family office contacts, 37,000 RIAs, and 750,000 registered reps, we offer unparalleled access to accurate and actionable information. Equipped with 375+ search filters, FINTRX allows you to seamlessly track the flow of private capital, uncover allocation trends and break down investment data. Our mission is to empower financial professionals by equipping them with the tools and insights needed to effectively engage and connect with potential investors.

FINTRX goes beyond basic contact details, providing in-depth profiles that include investment preferences, asset allocations, historical investment activity and so much more. This allows users to identify and target the most relevant prospects based on specific criteria, such as investment strategies, geographies and asset class preferences.
At FINTRX, we are committed to providing exceptional customer support and ensuring our users have the resources they need to succeed. Our team of experts is always available to provide personalized assistance, training, and guidance on how to leverage the platform effectively.


Copyright © 2026 FINTRX, Inc. All Rights Reserved. 18 Shipyard Drive Suite 2C Hingham, MA 02043 Data Privacy Policy
.png?width=367&height=109&name=ezgif.com-gif-maker%20(3).png)