START YOUR FREE TRIAL
GET STARTED
The Industry’s Most Trusted Private Wealth Data—Comprehensive, Accurate, and Current
Explore the leading platform used by asset managers to find and engage with RIAs, Broker-Dealers, Family Offices, Foundations & Endowments. Request your free trial of FINTRX now and see for yourself.
Blog & Resources
NEWS AND INSIGHTS FROM FINTRX
Q3 2022 Private Wealth Data Report
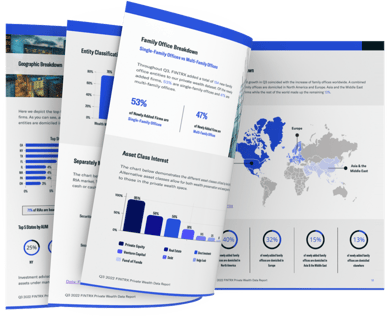
In an effort to shine a light on the Family Office & Registered Investment Advisor (RIA) markets, FINTRX Family Office and RIA Database provider has compiled the Q3 2022 Private Wealth Data Report to provide a high-level synopsis of the private capital markets for Q3. This 21-page report offers an inside look at all FINTRX platform updates and additions made throughout the quarter, as well as metrics such as assets under management, alternatives utilized, fee structures, geographic breakdowns, separately managed accounts, direct transactions and much more.
Note From Our CEO & Founder
Dear Reader,
On behalf of the FINTRX team, I would like to thank you for taking the time to read through our Q3 Private Wealth Data Report on the investment advisor and family office ecosystems.
In January 2022, FINTRX announced the release of its RIA data module, which features millions of investment advisor data points sourced from hundreds of thousands of sources.
This addition to our rapidly expanding suite of private wealth data provides high-level access to best-in-class RIA data, paired alongside our industry-leading family office data offering - all within a single unified platform.
At FINTRX, we strive to help asset-raising professionals better understand and tap into the private wealth space. From unpacking SEC filings in a digestible manner to uncovering hidden opportunities within their network, FINTRX ensures a unique and efficient path to access the private capital markets.
As the RIA and family office markets continue to shift, our research team remains dedicated to providing the most actionable and up-to-date investor data possible.
Thank you again for reading our Q3 Private Wealth Data Report. We look forward to a potential engagement with you and your team.
- Russ D'Argento, CEO & Founder, FINTRX
Introduction
Hello and welcome to the Q3 2022 FINTRX Private Wealth Data Report. This report provides a high-level synopsis of the global investment advisor and family office landscapes throughout Q3 with data compiled using the FINTRX Family Office & RIA Data Platform.
As registered investment advisors and family offices continue to gain traction, FINTRX offers an inside look at the private wealth landscapes by providing the tools necessary for productive and humanized outreach. Financial professionals now have global access to an array of tools specifically engineered to map, access and sell into the private capital markets.
The research contained within this report has been built with a bottom-up approach from our extensive RIA and family office dataset, as opposed to traditional small-sample survey data. As a result, we are able to share high-level insights into these impactful and previously opaque ecosystems.
All reports have been compiled from data derived by the FINTRX research team. A multifaceted approach was used to harvest the research from an array of sources. This practice comprises aggregating information from several public filings, proprietary data sources, strategic industry relationships and data mapping - among other origins.
Q3 2022 Registered Investment Advisor Data
What is an RIA?
A Registered Investment Advisor (RIA) is defined as an individual or firm registered with the Securities and Exchange Commission (SEC) or State Securities Authorities that advises or manages investments on behalf of individuals or institutions.
RIAs include a wide range of financial institutions such as banks, financial planners, hedge funds, family offices and asset managers, among others. It's important to note, the sample size used throughout this report does not include firms registered solely as broker dealers.
- - Total Registered Firms in Q3: 32,531
- - Total Firms Registered as Investment Advisors & Broker Dealers: 510
Accounts Breakdown
- - Total Accounts: 63,207,872 (63.21M)

- - Total Discretionary Accounts: 48,637,891 (48.64M)
- - Total Non-Discretionary Accounts: 14,569,981 (14.57M)
Alternatives Utilized
Of the firms identified as using alternatives, about 70% have allocated to the housing market to some degree.
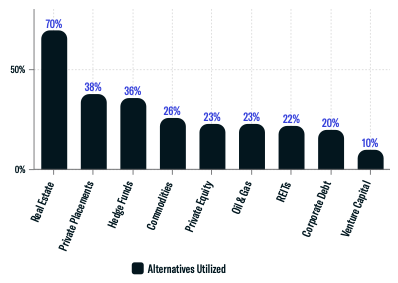
Additional alternatives used include Fund of Funds, Digital Currency, Managed Futures, Private Debt and Liquid Alternatives.
- - Total Firms Using Alternatives: 25,414
Assets Under Management (AUM)
Throughout Q3, 93% of AUM is discretionary, while 7% is non-discretionary.

- - Total Assets Under Management: $128,538,772,315,370
- - RIA Assets Under Management: $119,938,934,543,752
- - Dually Registered Assets Under Management: $8,599,837,771,618
Firm Size by Assets
The chart below displays a breakdown of assets under management (AUM) based on the size of the firm.
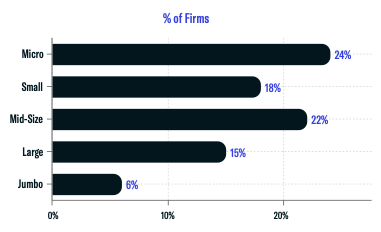
Micro: $1-$25,000,000
Small: $25,000,001 - $100,000,000
Mid-Size: $100,000,001 - $500,000,000
Large: $500,000,001 - $5,000,000,000
Jumbo: $5,000,000,001+
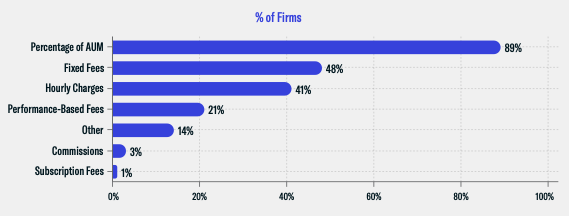
Fee Structures
89% of RIAs are compensated through a percentage of assets under management (AUM). Others use fixed fees, hourly charges, and performance-based fees as a means to charge clients.
Contact Breakdown
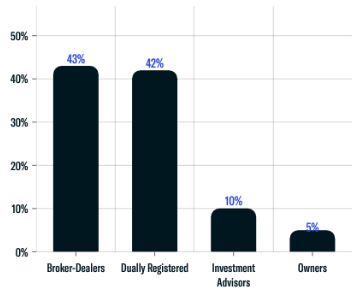
- - Total Contacts: 736,819
- - Female Reps: 26%
- - Male Reps: 74%
Geographic Breakdown
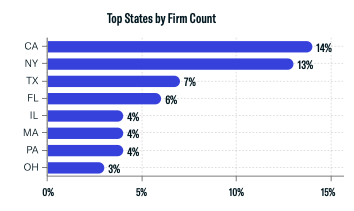
Here we depict the top US states with the most registered firms. As you can see, a high concentration of registered entities are domiciled in California and New York. 71% of RIAs are headquartered in offices throughout the US.
Top 5 States by AUM
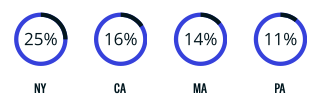
Investment advisory firms account for about $113.9T in assets under management throughout the quarter. New York accounts for 25% of investment advisory AUM throughout Q3. California and Massachusetts followed at 16% and 14%, respectively.
Entity Classifications
Separately Managed Accounts (SMAs)
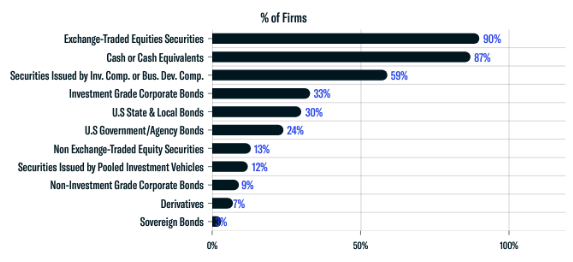
The chart below shows the types of investments held through separately managed accounts (SMAs) across the RIA market. Throughout Q3, 90% of firms held Exchange-Traded Equities within their SMAs, while 87% held cash or cash equivalents.
Business Activities
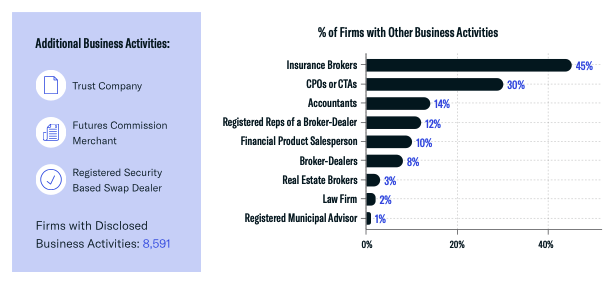
Registered investment advisors often provide an array of wealth management solutions to its clients. Below, we display the most popular business activities throughout the quarter. Insurance Brokers and CPOs or CTas are the most utilized, at 45% and 30% respectively.
RIA Services Provided
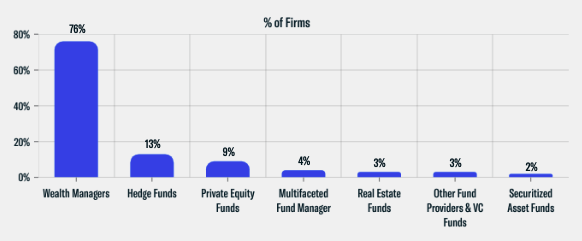
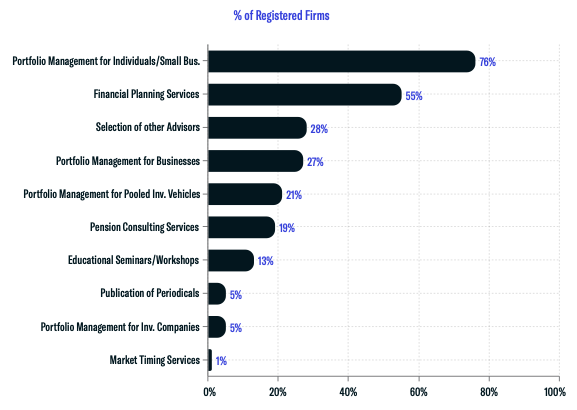
Registered investment advisors provide a range of services, the most common being Portfolio Management for Individuals and Small Businesses, which is offered by 76% of all registered firms. Other common services include Financial Planning, Selection of other Advisors and Portfolio Management for Businesses.
Count of Firms (Top 3)
- - Portfolio Management for Ind./Small Business: 24,233
- - Financial Planning Services: 17,683
- - Selection of other Advisors: 8,900
Q3 2022 Family Office Data
- New Family Offices: 154
- New Family Office Contacts: 1,120+
- Family Office Contacts Updated: 3,470+
- Family Office Updates: 4,100+
- Newly Tracked Family Office Investments: 920+
- Total Family Office Additions: 2,190+
- Total Family Office Assets Added: $145.5B+
- Total Material Changes/Updates Made: 6,300+
Single-Family Offices vs Multi-Family Offices
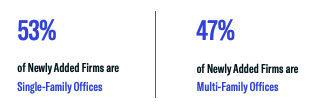
Throughout the course of Q3, FINTRX added a total of 154 new family office entities to our private wealth data and research platform. 53% of newly added firms are single-family offices while 47% are multi-family offices.
Asset Class Interest Breakdown
The chart below demonstrates the different asset classes utilized by family offices throughout the quarter. Alternative asset classes allow for both wealth preservation and asset growth making them attractive options to those in the private wealth space.
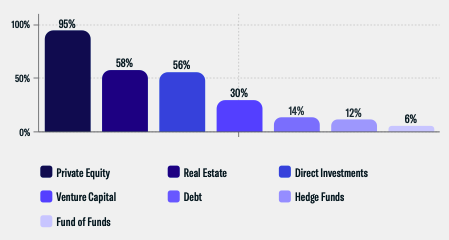
A majority of new family offices displayed tendencies to invest in private equity, real estate and via direct investments. A combined 32% of firms showed interest in debt, hedge funds and fund of funds.
Assets Under Management (AUM)
Here we outline the assets under management ranges of new family offices added to our dataset throughout the quarter. The most prevalent among this sample size are groups with assets between $100M-$400M, at 24%. Family offices with AUM between $400M-$1B and $2B-$5B followed at 21%, respectively.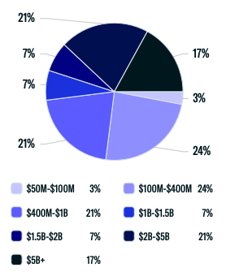
- Total Family Office Assets Added to FINTRX in Q3: $145.5 Billion
Single Family Office Origin of Wealth Analysis
One of the more prevalent patterns drawn from our research is the relation between the industry in which of wealth origin and the industry of investment interest. With that being said, there is a clear tendency for groups to invest in opportunities throughout familiar industries.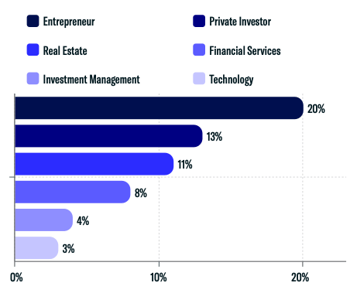
A majority of single-family offices (SFOs) added to our data set in Q3 created their wealth as entrepreneurs, private investors or through real estate ventures. It's important to note that family offices can have more than one origin of wealth.
Geographic Breakdown
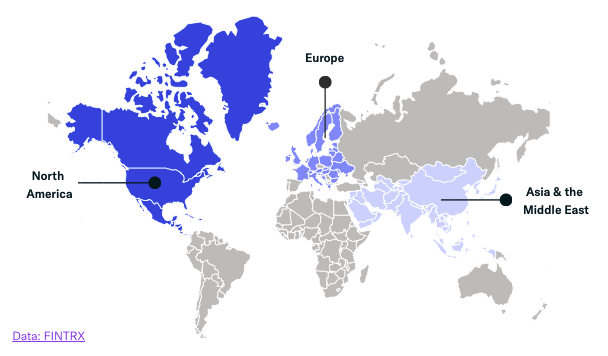
Our dataset's continued growth in Q3 coincided with the increase of family offices worldwide. A combined 72% of newly added family offices are domiciled in North America and Europe. Asia and the Middle East accounted for 15% of firms while the rest of the world made up the remaining 13%.
Top Regions with New Family Office Activity
- North America: 40%
- Europe: 32%
- Asia & the Middle East: 15%
- Rest of World: 13%
Direct Transactions by Sector
Throughout our research, we continue to see family offices harnessing direct investment opportunities. The shift toward direct investments is often based on the desire to have greater control over decisions relating to asset allocation. Direct transactions allow family offices to invest in or buy companies of a preferred size or industry which often leads to greater fruition down the road.
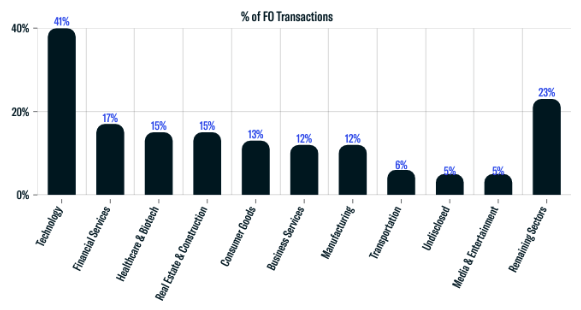
Technology remained the leading industry for family office investments at 41%, with 380+ transactions made into private tech companies throughout the quarter. Additional sectors of interest include healthcare & biotech, real estate & construction, consumer goods, business services and manufacturing, among others.
Download the Report
FINTRX provides comprehensive data intelligence on 850,000+ family office & investment advisor records, each designed to help you identify, access and map the private wealth ecosystem. Explore in-depth dossiers on each family office & investment advisor. Access AUM, source of wealth, investment criteria, previous investment history, sectors & industries of interest, and advisor growth signals, among other key data points.
Additionally, FINTRX provides insight and expansive contact information on 850,000+ decision-makers, featuring job titles, direct email addresses, phone numbers, common connections, alma maters, past employment history, brief bios & much more.
For additional details and a live walkthrough, request a demo below.
Written by: Renae Hatcher |
November 30, 2022
Renae Hatcher is a member of the marketing team at FINTRX - focused on delivering targeted & relevant family office and registered investment advisor content to our subscribers.
Similar Content
COMPANY
COMPARE US

Copyright © 2025 FINTRX, Inc. All Rights Reserved. 18 Shipyard Drive Suite 2C Hingham, MA 02043 Data Privacy Policy
.png?width=367&height=109&name=ezgif.com-gif-maker%20(3).png)


