
To shine a light on the Registered Investment Advisor (RIA) landscape, FINTRX - Family Office and RIA Database provider - has compiled the Q2 2022 Registered Investment Advisor (RIA) Data Report to provide a high-level synopsis of the investment advisory landscape for Q2. Explore metrics such as total registered firms, alternatives used, assets under management, representative breakdown, services provided, geographic breakdown, and more.
Introduction
Hello and welcome to the Q2 2022 Registered Investment Advisor (RIA) Data Report. This report provides a high-level synopsis of the investment advisor landscape with data compiled using the FINTRX Family Office & RIA Data Platform.
We define Registered Investment Advisors (RIAs) as individuals or firms registered with the Securities and Exchange Commission (SEC) or State Securities Authorities that advise or manage investments on behalf of individuals or institutions. RIAs include a wide range of financial institutions such as banks, financial planners, hedge funds, family offices, asset managers, and wealth managers, among others.
It is important to note that the sample size used throughout this report does not include firms registered solely as broker-dealers.
- - Total Registered Firms: 32,211
- - Total Firms Registered as Investment Advisors & Broker Dealers: 472
Note From our VP of Research
Dear Reader,
Thank you for taking the time to read through our Q2 Data Report on the Registered Investment Advisor market.
Nearly two years ago we created a research tool, in the likeness of our family office product, that would greatly improve our clients’ efficiency when targeting the RIA industry. After months of dedicated effort across the research and product teams, FINTRX launched the Registered Investment Advisor database to efficiently connect your business to 38,800+ entities and nearly 730,000 reps working within the RIA landscape.
The following report is a high-level examination of the RIA landscape throughout Q2 of 2022. The figures provided within have been gathered entirely from the FINTRX RIA platform after having been aggregated from several sources and analyzed using dozens of native algorithms.
We look forward to engaging with your company and appreciate your interest in our report.
- Dennis Caulfield, Vice President of Research, FINTRX
Accounts Breakdown
- - Total Accounts: 63,117,453
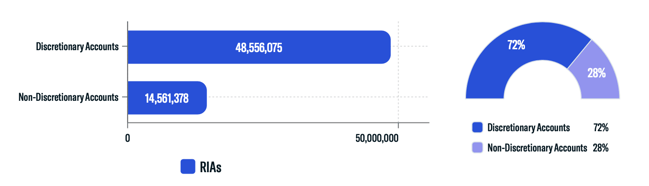
- - Total Discretionary Accounts: 48,556,075
- - Total Non-Discretionary Accounts: 14,561,378
Alternatives Utilized
Throughout Q2, we found the most used alternatives to be Real Estate at 70%, Private Placements at 38%, and Hedge Funds at 37%.
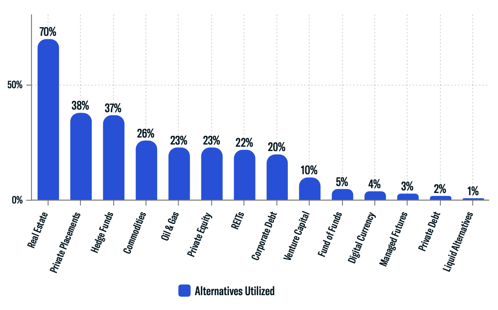
- - Total Firms Using Alternatives: 25,120
Assets Under Management (AUM)
Throughout Q2, 92% of AUM is discretionary, while 8% is non-discretionary. Since Q1, total assets increased by 12.8%.
.png?width=612&name=Assets%20Under%20Management%20(AUM).png)
- - Total Assets Under Management: $128,469,623,609,235
- - RIA Assets Under Management: $119,869,036,984,612
- - Dually Registered Assets Under Management: $8,600,586,624,623
The chart below displays a breakdown of assets under management (AUM) based on the size of the firm.
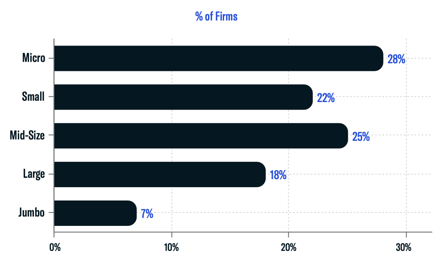
Micro: $1-$25,000,000
Small: $25,000,001 - $100,000,000
Mid-Size: $100,000,001 - $500,000,000
Large: $500,000,001 - $5,000,000,000
Jumbo: $5,000,000,001+
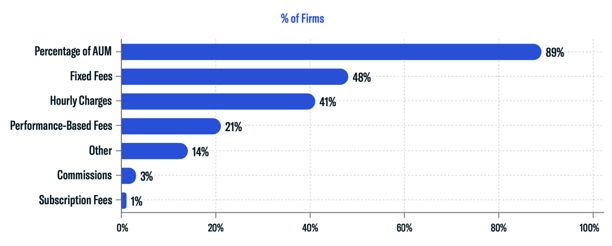
Fee Structures
89% of RIAs are compensated through a percentage of assets under management (AUM). Others use fixed fees, hourly charges, and performance-based fees as a means to charge clients.
Contact Breakdown
- - Total Contacts: 731,088
- - Female Reps: 26%
- - Male Reps: 74%
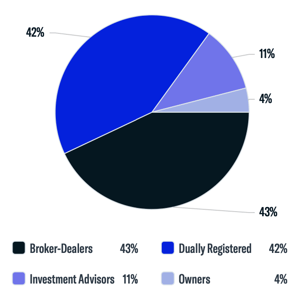
Entity Classifications
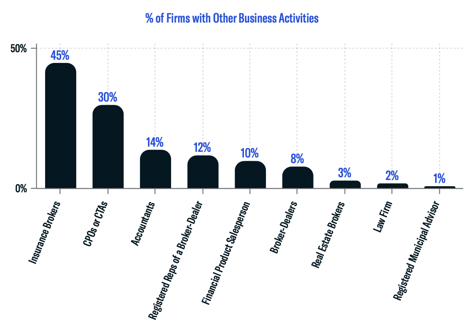
Business Activities
This chart denotes the additional business activities provided by registered investment advisors throughout Q2 of 2022.
Separately Managed Accounts (SMAs)
The chart below shows the types of investments held through separately managed accounts (SMAs) across the RIA market. Throughout Q2, 90% of firms held Exchange-Traded Equities within their SMAs, while 87% held cash or cash equivalents. Securities issued by investment companies or business development companies followed at nearly 60%.
.png?width=552&name=Separately%20Managed%20Accounts%20(SMAs).png)
- - Total Firms Using SMAs: 22,807
Geographic Breakdown
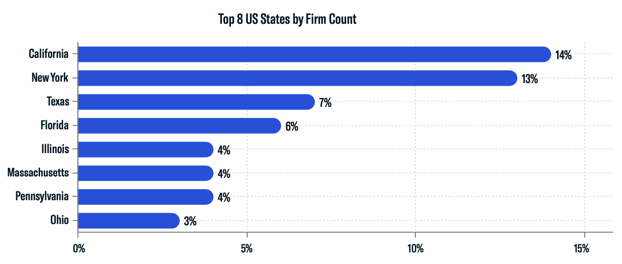
The chart above depicts the states with the most registered firms. A high concentration of registered entities are domiciled in California (14%) New York (13%) and Texas (7%). North-Eastern states (New York, Maine, Vermont, New Hampshire, Massachusetts, Connecticut, Rhode Island, and Pennsylvania) account for 25% of the RIA market. It's important to note that about 97% of RIAs are headquartered in offices throughout the United States.
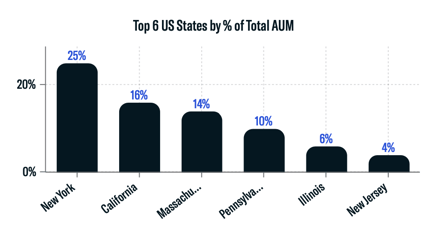
New York accounts for 25% of investment advisory Assets Under Management (AUM) throughout Q2. California and Massachusetts followed at 16% and 14%, respectively.
RIA Services Provided
Registered investment advisors provide a range of services, the most common being Portfolio Management for Individuals and Small Businesses, which is offered by 76% of all registered firms. Other common services include Financial Planning, Selection of other Advisors and Portfolio Management for Businesses.
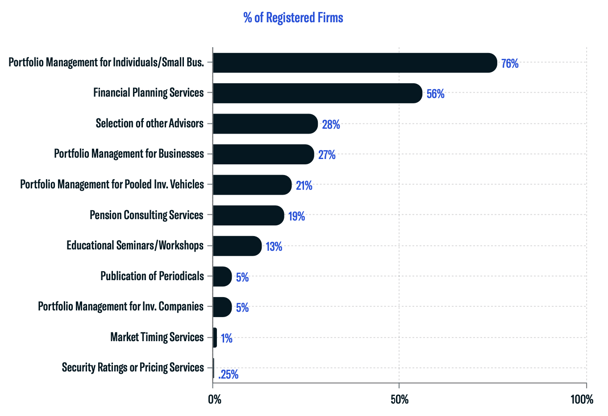
- Count of Firms (Top 3)
- - Portfolio Management for Individuals/Small Business: 24,079
- - Financial Planning Services: 17,544
- - Selection of other Advisors: 8,866
Download the Report


FINTRX provides comprehensive data intelligence on 850,000+ family office & investment advisor records, each designed to help you identify, access and map the private wealth ecosystem. Explore in-depth dossiers on each family office & investment advisor. Access AUM, source of wealth, investment criteria, previous investment history, sectors & industries of interest, and advisor growth signals, among other key data points.
Additionally, FINTRX provides insight and expansive contact information on 850,000+ decision-makers, featuring job titles, direct email addresses, phone numbers, common connections, alma maters, past employment history, brief bios & much more.
For additional details and a live walkthrough, request a demo below.


Copyright © 2026 FINTRX, Inc. All Rights Reserved. 18 Shipyard Drive Suite 2C Hingham, MA 02043 Data Privacy Policy
.png?width=367&height=109&name=ezgif.com-gif-maker%20(3).png)