
In an effort to shed light on the family office and registered investment advisor (RIA) landscapes, FINTRX - Family Office & RIA Database provider - has issued the Q4 2022 Private Wealth Data Report to provide a fourth-quarter analysis of the private capital markets. 2022 underwent unprecedented challenges and changes in the financial services sector, but how have family offices and RIAs been affected? This end-of-year quarterly report offers a comprehensive overview of the latest trends, growth patterns and key insights regarding the family office and RIA ecosystems.
Introduction
In addition to a comprehensive analysis of the most recent trends and insights into the global family office and RIA channels, the report outlined below provides an inside look at all FINTRX platform updates and additions made throughout Q4. Key data insights include family office and registered investment advisor investment strategies, direct transactions, contact breakdowns, assets under management, geographic breakdowns and more, offering valuable investment insights for industry professionals and investors alike.
Throughout the quarter, the FINTRX data set grew to include 3,500+ family offices, 19,600+ family office contacts, nearly 24,000+ tracked family office investments, 38,900+ registered investment advisor entities, and 740,000+ investment advisor reps, among others.
By providing the resources required for effective and personable outreach, FINTRX offers an inside look at the private wealth ecosystem as family offices and RIA firms continue to gain traction. Rather than using conventional small-sample survey data, the research presented in this report was constructed from the ground up using data from our vast family office and RIA dataset. As a result, we are able to share high-level insights into these impactful and previously opaque markets. Through our continued expansion of strategic partnerships, private sourcing methods and public aggregation, FINTRX ensures credible private wealth intel to our global client base.
Note From Our VP of Research
Dear Reader,
On behalf of the FINTRX team, I would like to thank you for taking the time to read through our Q4 Private Wealth Data Report on the global family office and registered investment advisor (RIA) ecosystems.
In January 2022, FINTRX announced the release of its RIA data module, which features millions of investment advisor and broker-dealer data points sourced from hundreds of thousands of sources. This addition to our quickly growing collection of private wealth intel offers high-level access to best-in-class RIA data paired alongside our industry-leading family office data offering - all within a single integrated platform.
At FINTRX, we work to improve asset-raising professionals' knowledge of and access to the private wealth landscape. From unpacking SEC filings to unearthing hidden opportunities within their network, FINTRX provides a unique and efficient route to accessing the private capital markets.
As the landscapes for family offices and registered investment advisors continue to evolve, our research team remains committed to providing the most actionable and updated investor data available.
Again, thank you for reading our Q4 Private Wealth Data Report, and we look forward to a potential engagement with you and your team.
- Dennis Caulfield, Vice President of Research
Family Office Data
Insights into the Family Office Ecosystem Throughout Q4 2022 as well as Updates & Additions to the FINTRX Family Office Dataset
- New Family Offices Added: 170
- New Family Office Contacts Added: 870+
- Newly Tracked Family Office Investments: 880+
- Total Family Office Additions: 1,930+
- Total Family Office Assets Added: $207.25B+
- Family Office Contacts Updated: 2,250+
- Total Family Office Updates: 7,900+
- Total Material Changes/Updates Made: 9,800+
Single-Family Offices vs Multi-Family Offices
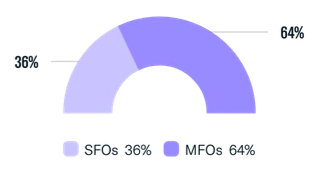
Single-family offices (SFOs) are private wealth management firms that serve the needs of a single high-net-worth family or individual, providing customized financial and investment services. SFOs are unique to each family or individual, serving their specific financial and personal needs.
On the other hand, multi-family offices (MFOs) provide similar services to multiple affluent families or individuals, often sharing resources and expertise among clients to reduce costs, improve services and offer a more standardized approach to wealth management.
A total of 170 new family office entities were added to our dataset by FINTRX during Q4. Single-family offices make up 36% of the newly added firms, while multi-family offices make up 64%.
Asset Class Interest
Family offices, whether single or multi, typically have a broad investment interest across various asset classes. Alternative asset classes allow for both wealth preservation and asset growth making them attractive options to those in the private wealth space.
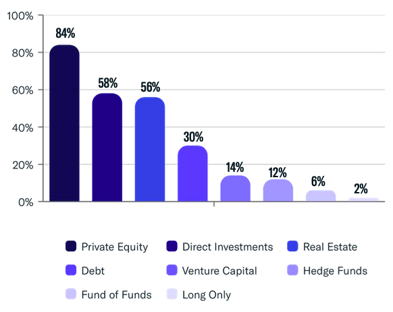
The numerous asset classes that family offices used throughout the quarter are shown in the chart above. A majority of family offices displayed tendencies to invest in private equity, direct investments, real estate and debt.
Assets Under Management (AUM)
Assets Under Management (AUM) refers to the total market value of the assets that family offices manage on behalf of their clients. AUM typically includes a variety of assets such as stocks, bonds, real estate, private equity, hedge funds, commodities and other alternative investments. The AUM of family offices often varies greatly, depending on the size and wealth of the families they serve.
The AUM ranges of new family offices added to our dataset during Q4 are presented here. The most prevalent among this sample size are firms with assets between $400M-$1B, at 25%. Family offices with AUM between $100M-$400M and $2B-$5B followed at 21% and 19% respectively.
.png?width=366&height=191&name=Family%20Office%20Assets%20Under%20Management%20(AUM).png)
- Family Office Assets Added to FINTRX in Q4: $207.25 Billion
Single-Family Office Origin of Wealth Analysis
The direct relationship between the industry in which wealth originates and the industry of interest for investments is one of the more pervasive patterns revealed by our research. There is a certain propensity for groups to invest in well-known industries.
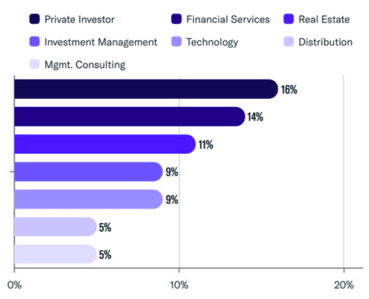
A majority of single-family offices added to our data set in Q4 created their wealth as private investors, through financial services, real estate and investment management. It's important to note that family office wealth can come from multiple sources.
Geographic Breakdown
This breakdown refers to the geographic location of new family offices added to our dataset throughout the quarter. The steady expansion of our family office dataset in Q4 matched the global rise in family offices.
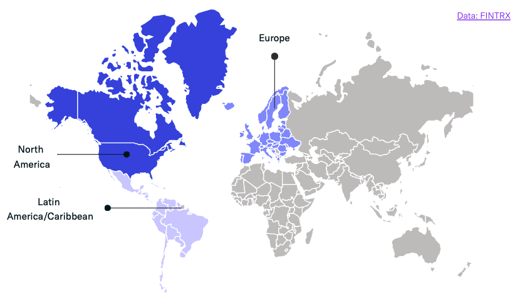
A combined 85% of newly added family offices are domiciled in North America and Europe. Latin America/Caribbean accounted for 6% of new firms while the rest of the world made up the remaining 9%.
Top Regions with New Family Office Activity
- North America: 51%
- Europe: 34%
- Latin America/Caribbean: 6%
- Rest of World: 19%
Family Office Direct Transactions by Sector
Throughout our research, we continue to see family offices harnessing direct investment opportunities. The move toward direct investments is frequently motivated by a desire for more power over decisions involving asset allocation. Family offices can invest in or purchase businesses in their preferred sectors or sizes through direct transactions, which frequently results in longer-term success.
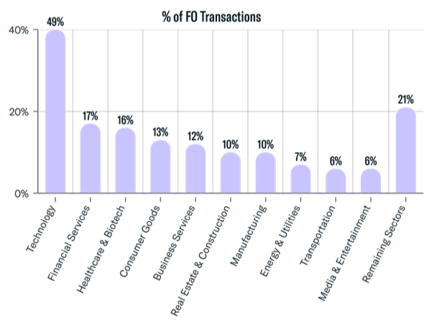
Technology remained the leading industry for family office investments at 49%, with 430+ transactions made into private tech companies throughout the quarter. Additional sectors of interest include financial services, healthcare & biotech, consumer goods, business services, real estate & construction and manufacturing, among others.
- Newly Tracked Family Office Investments in Q4: 880+
Registered Investment Advisor (RIA) Data
Insights into the RIA Ecosystem Throughout Q4 2022 as well as Updates & Additions to the FINTRX Family Office Dataset
What is an RIA?
A registered investment advisor (RIA) is an individual or firm registered with the Securities and Exchange Commission (SEC) or State Securities Authorities that advises or manages investments and assets on behalf of individuals or institutions. RIAs are held to a fiduciary standard, which means they are legally required to act in the best interest of their clients.
Registered investment advisors include a wide range of financial institutions such as banks, financial planners, hedge funds, family offices and asset managers, among others. It's important to note, the sample size used throughout this report does not include firms registered solely as broker-dealers.
RIA firms have been on the rise in recent years as more and more individuals are choosing to invest their money through these firms rather than traditional financial institutions. The growth of RIA firms can be attributed to the combination of increased demand for personalized financial advice, a shift towards fee-based models, a favorable regulatory environment, technology advancements, access to alternative investments and the growth of passive investing.
Firm Type Breakdown
Throughout Q4, the FINTRX Family Office & Registered Investment Advisor Data & Research Platform added a total of 32,600+ registered firms to our RIA dataset.
- Total Registered Firms: 32,694
Accounts Breakdown
- Total Accounts: 63.25M+
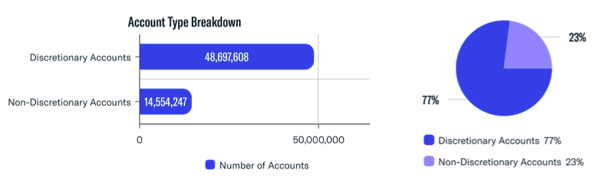
- - Total Discretionary Accounts: 48.69M+ (77%)
- - Total Non-Discretionary Accounts: 14.55M+ (23%)
Alternatives Utilized
RIAs frequently utilize alternatives to diversify client portfolios, reduce risk and generate higher returns as opposed to traditional investments. Alternatives typically have lower correlations to the stock market and are therefore less volatile during periods of market movement.
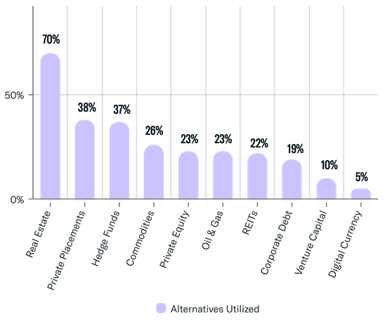
Approximately 70% of registered investment advisory firms that identified as using alternatives allocated to real estate to some degree. Private placements, hedge funds, commodities, private equity, oil & gas and REITs were further options utilized throughout the quarter.
Assets Under Management (AUM)
92% of AUM was discretionary throughout the quarter, compared to 8% of non-discretionary assets.
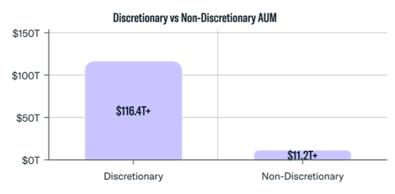
- - Total Assets Under Management: $127.57T+ ($116.4T+ Discretionary; $11.2T+ Non Discretionary)
- - RIA Assets Under Management: $118.9T+
- - Dually Registered Assets Under Management: $8.5T+
Firm Size by Assets
Registered investment advisor assets under management are broken down by company size in the chart below.
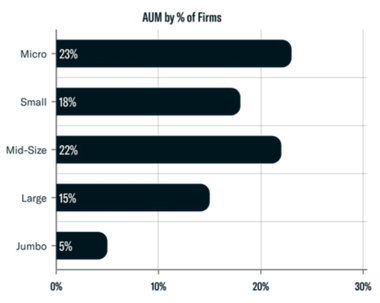
Micro: $1-$25,000,000
Small: $25,000,001 - $100,000,000
Mid-Size: $100,000,001 - $500,000,000
Large: $500,000,001 - $5,000,000,000
Jumbo: $5,000,000,001+
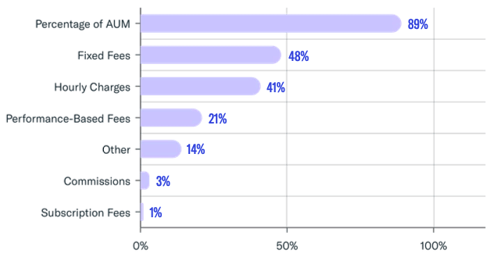
Fee Structures
The fee structure of registered investment advisors varies widely depending on the services they provide. Throughout the quarter, 89% of RIAs charged clients through a percentage of their assets under management. Others used fixed fees, hourly charges and performance-based fees as a means to charge clients.
Contact Breakdown
- Total RIA Contacts: 743,100+
- - Female Reps: 26%
- - Male Reps: 74%
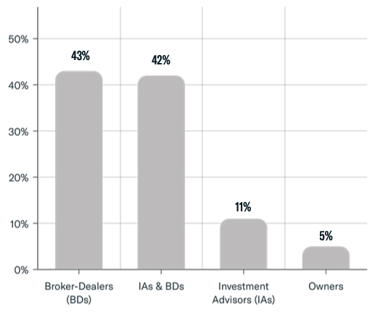
- - Broker-Dealers: 43%
- - Investment Advisors & Broker-Dealers: 42%
- - Investment Advisors: 11%
- - Owners: 5%
Geographic Breakdown
The geographic breakdown of RIAs varies depending on the state or region in which they operate. In general, many states have a well-developed RIA infrastructure, including large concentrations of independent RIAs in major cities. 96% of RIAs are headquartered in offices throughout the US. The chart below depicts the top US states with the most registered firms. A high concentration of registered entities are domiciled in California and New York.
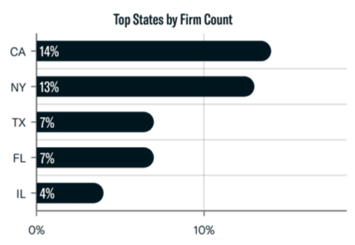
25% of the assets managed by investment advisor firms are located in New York. Massachusetts and California followed at 16% and 14%, respectively.
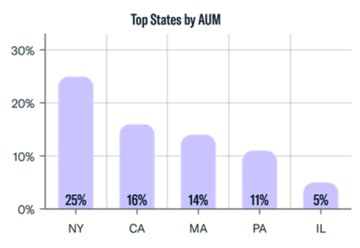
The United States accounts for about $113.3T in RIA assets under management throughout the quarter.
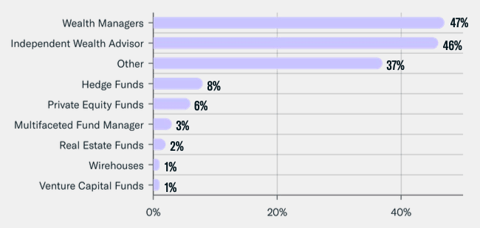
Entity Classifications
RIA entity classifications often determine regulatory requirements and impact the benefits and drawbacks of the business. A majority of RIAs added to our dataset throughout Q4 classified themselves as wealth managers and independent wealth advisors at 47% and 46% respectively.
Separately Managed Accounts (SMAs)
The RIA market's separately managed accounts are represented by the various investment categories in the figure below. 90% of companies owned exchange-traded stocks while 87% maintained cash or cash equivalents.
.png?width=491&height=383&name=RIA%20Separately%20Managed%20Accounts%20(SMAs).png)
Other SMAs utilized throughout the quarter include securities issued by investment or business development companies, investment grade corporate bonds and U.S State & Local Bonds, among numerous others.
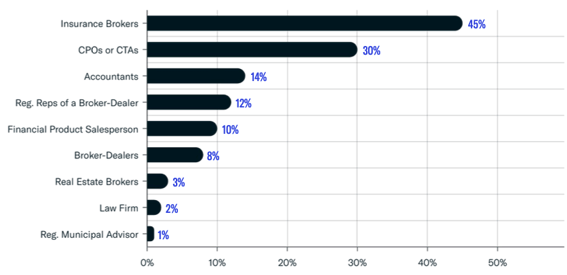
Business Activities
Registered investment advisors frequently provide their clients a variety of wealth management products. The most popular business activities for the quarter are shown in the table below. At 45% and 30%, respectively, insurance brokers and CPOs or CTAs are most frequently used.
RIA Services Provided
Registered investment advisors often provide an array of wealth management services to their clients. Throughout the quarter, 76% of all registered firms provided portfolio management for individuals and small businesses and 55% of registered firms offered financial planning services.
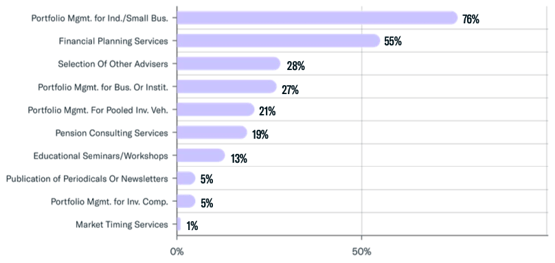
Other common services provided include the selection of other advisors, portfolio management for businesses or institutions, portfolio management for pooled investment vehicles and pension consulting services, among others.
Download the Report


Private Wealth Market Intelligence
In order to assist asset-raising professionals in locating, accessing and mapping the global private wealth ecosystem, FINTRX, a unified family office and registered investment advisor (RIA) data & research platform, offers comprehensive data intelligence on 850,000+ family office & investment advisor records.
Access AUM, source of wealth, investment criteria, prior investments, advisor growth signals, sectors and industries of interest and much more. FINTRX empowers you to keep your finger on the pulse of the rapidly changing and rather opaque private wealth ecosystem.
For further insight on how FINTRX can streamline your capital-raising efforts, request a demo below.


Copyright © 2026 FINTRX, Inc. All Rights Reserved. 18 Shipyard Drive Suite 2C Hingham, MA 02043 Data Privacy Policy
.png?width=367&height=109&name=ezgif.com-gif-maker%20(3).png)