
INTRODUCING FINTRX M&A SMARTVIEW
AI-Driven M&A Intelligence To Pinpoint Your Next Deal
M&A Intelligence Tailored To You
AI-powered acquisition scoring, firm targeting criteria, and relationship mapping with your firm’s unique M&A strategy.

Proprietary Acquisition Score
Quickly prioritize high-fit M&A targets with a proprietary, AI-powered score that evaluates AUM growth, advisor tenure, firm structure, and ownership model—pinpointing firms most likely to transact.
Custom Fit Analysis
Tailor every opportunity to your strategy with AI-driven insights that surface green lights and red flags based on your acquisition goals, rick tolerance, and operational preferences.
Historical Growth & Team Insights
Access key metrics like AUM trajectory, advisor count trends, and personnel structure to assess scalability, succession planning risk and long-term viability.
Integrated AI Analyst
Evaluate firms in seconds with built-in AI prompts that generate instant analysis on. M&A readiness, historical growth, custodian overlap, and integration potential.
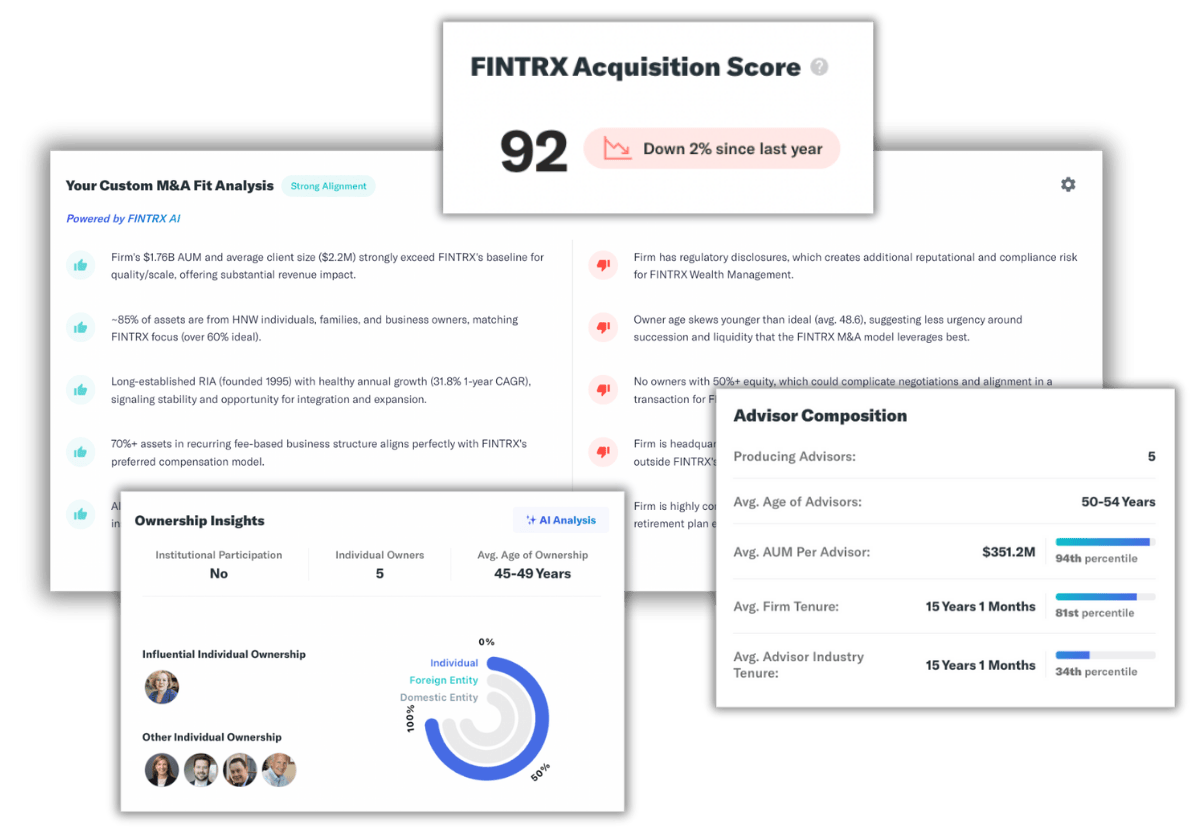
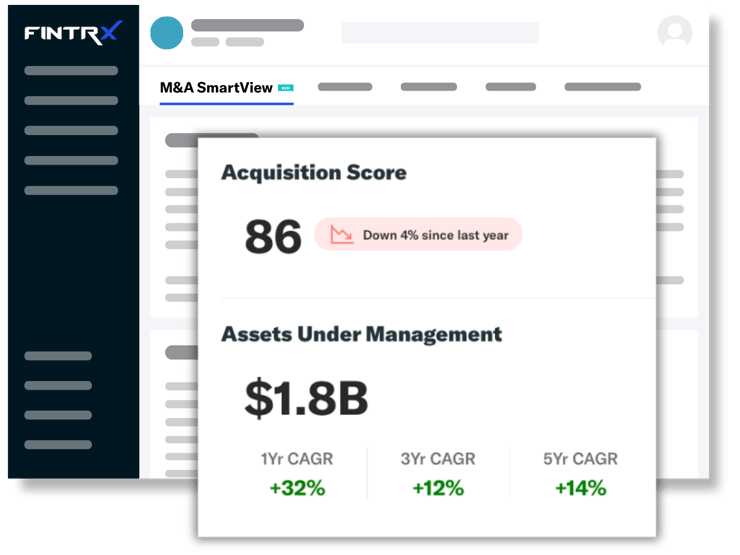
FINTRX ACQUISITION SCORE
Score Targets with Precision
Leverage the FINTRX Acquisition Score to instantly assess which firms are most likely to transact—based on proprietary signals like AUM growth, rep stability, and ownership structure.
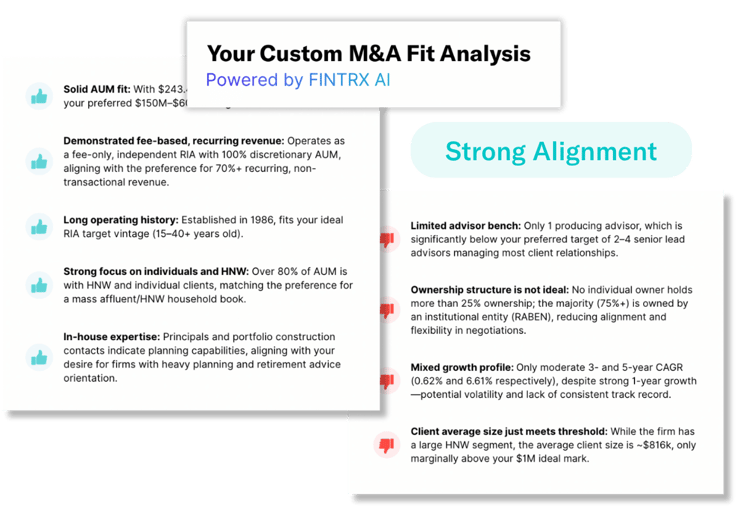
CUSTOM FIT ANALYSIS
Find Your Best-Fit Opportunities
FINTRX SmartView leverages comprehensive data and AI to surface firm-specific green lights and red flags, aligning each prospect to your exact acquisition strategy and preferences.
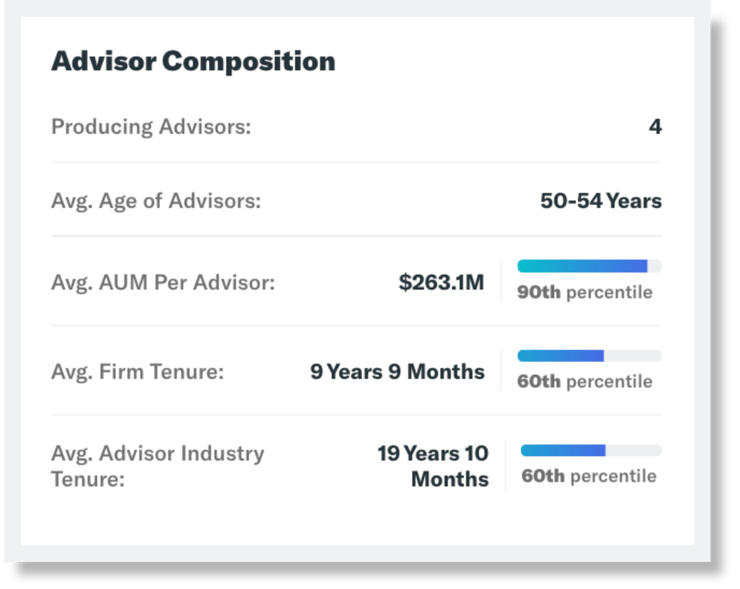
ORG STRUCTURE BREAKDOWN
Evaluate Team Dynamics & Risk
Org Structure Breakdown reveals key decision-makers, advisor tenure, and rep distribution—helping you assess succession planning risk and internal alignment.
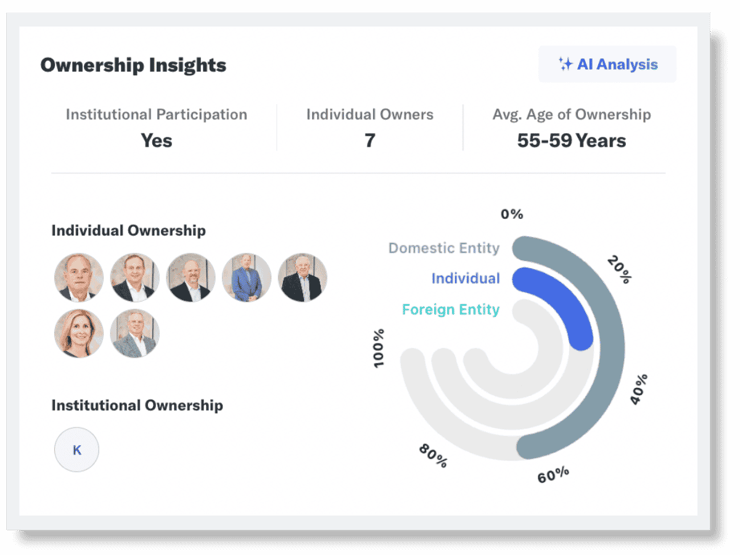
OWNERSHIP MODEL INSIGHTS
Understand Control Before You Engage
Ownership Model Insights uncover whether a firm is independently owned, hybrid, or institutionally backed—vital for assessing deal feasibility and control expectations.
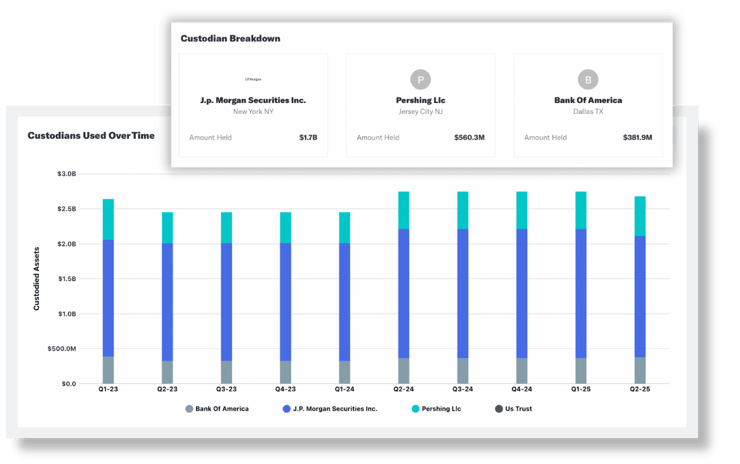
CUSTODIAN DATA
Assess Custodian Compatibility
Custodian Data shows which platforms the firm uses and to what extent—giving you insight into integration complexity and operational fit.
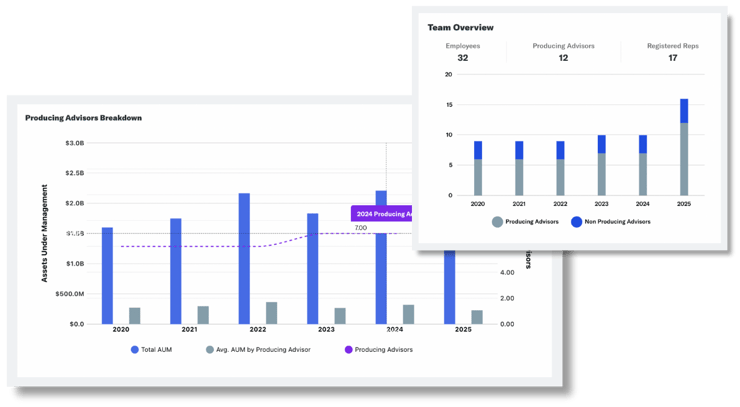
HISTORICAL TRENDS
Spot Scalable Growth Signals
Historical Trends track AUM performance, advisor count shifts, and expansion patterns—highlighting firms with sustainable models and acquisition upside.
Frequently Asked Questions

Can I customize M&A SmartView to match my firm's acquisition strategy?
How does M&A SmartView determine which firms are acquisition-ready?
What kind of firms does M&A SmartView cover?
How is FINTRX AI used within SmartView?
Can I integrate SmartView data into my CRM or internal systems?
How often is M&A SmartView data updated?
total assets tracked
total data points covered

FUNDRAISING
Family Office & Investment Advisor Data Optimized For Fundraising
Access to family office and investment advisor data for fundraising purposes has never been easier. Our intelligent registered investment advisor data is engineered to efficiently deliver comprehensive and accurate data. Using automation, artificial intelligence and our expansive research team, we put real time data in your hands to ensure successful outcomes.
.png?width=220&height=57&name=all%20white%20fintrx%20logo%20(2).png)


.png?width=367&height=109&name=ezgif.com-gif-maker%20(3).png)