
Every month, the FINTRX Private Wealth Database adds and updates thousands of family offices, registered investment advisors (RIAs), decision-makers and an array of tracked investment and asset information to our dataset. To illustrate this growth, we have compiled the Monthly Family Office & RIA Data Report for January 2024, showcasing key metrics such as assets under management (AUM), alternative investments, fee models, geographic distributions, separately managed accounts, direct transactions by family offices, services offered by RIAs and more.
January '24 FINTRX Family Office & RIA Data Report
Download the Report


January '24 Family Office Data
Family Office Platform Additions
The FINTRX Data & Research team added 40+ new family offices, 480+ family office contacts and 500+ direct investment transactions to our Family Office Dataset.
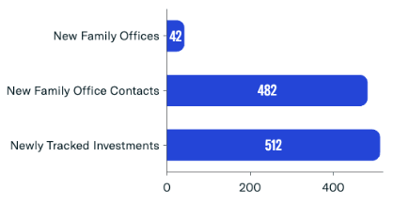
- - New Family Offices: 42
- - New Family Office Contacts: 482
- - Newly Tracked Family Office Investments: 512
Updated Family Office Entities
In addition to 1,030+ platform additions, FINTRX made nearly 5,500+ family office updates including 400+ firm updates and 5,100+ contact updates.
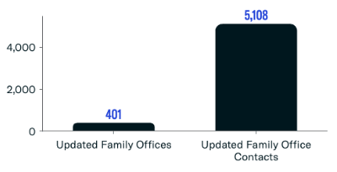
- - Updated Family Offices: 401
- - Updated Family Office Contacts: 5,108
Single Family Offices vs. Multi-Family Offices
69% of newly added firms in January are single family offices (SFOs) while 31% are multi-family offices (MFOs).
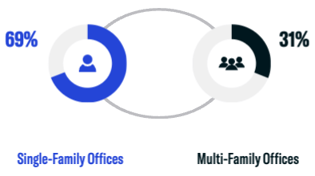
- - New Single Family Office Additions: 69%
- - New Multi-Family Office Additions: 31%
Assets Under Management (AUM) Breakdown
A majority (23%) of family offices added in January manage between $2 billion and $5 billion in assets on behalf of their clients. Just 5% of added firms manage between $50 million and $100 million.
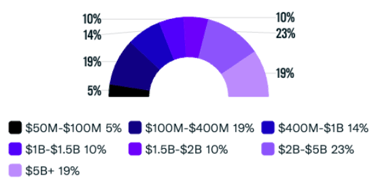
- - $50M - $100M: 5%
- - $100M - $400M: 19%
- - $400M - $1B: 14%
- - $1B - $1.5B: 10%
- - $1.5B - $2B: 10%
- - $2B - $5B: 23%
- - $5B+: 19%
Asset Class Interest Breakdown
When it comes to the asset class interest of newly added family offices, FINTRX continued to see a majority of firms (81%) allocating via direct investments into private companies, followed by real estate and private equity.
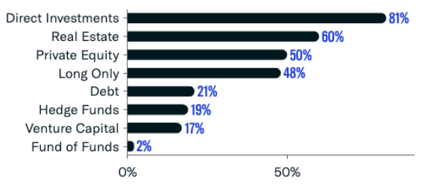
- - Direct Investments: 81%
- - Real Estate: 60%
- - Private Equity: 50%
- - Long Only: 48%
- - Debt: 21%
- - Hedge Funds: 19%
- - Venture Capital: 17%
- - Fund of Funds: 2%
Family Office Geographical Breakdown
The vast majority of family offices added to the FINTRX Family Office Dataset in January are headquartered in North America, accounting for 74% of total firms. European offices accounted for roughly 22%, with the Middle East and Latin America/Caribbean making up the remaining offices.
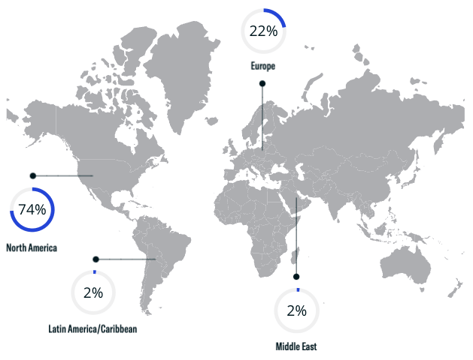
- - Europe: 22%
- - Asia & Middle East: 4%
- - Latin America/Caribbean: 2%
Newly Tracked Family Office Investments
Top 10 Sectors of Interest
Throughout January, FINTRX saw a majority of newly tracked family office investments made into private technology companies, which accounted for nearly 200 direct transactions of the total 512 newly tracked investments. Other top sectors of interest included healthcare & biotechnology, financial services and manufacturing.
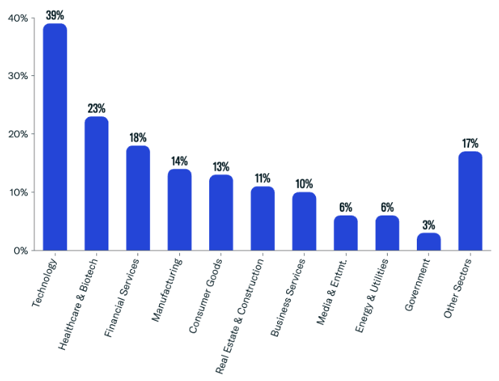
- - Technology: 39%
- - Healthcare & Biotech: 23%
- - Financial Services: 18%
- - Manufacturing: 14%
- - Consumer Goods: 13%
- - Real Estate & Construction: 11%
- - Business Services: 10%
- - Media & Entertainment: 6%
- - Energy & Utilities: 6%
- - Government: 3%
January '24 Registered Investment Advisor (RIA) Data
RIA Data Highlights: January Platform Additions
- - Total Registered Entities (including Dually Registered): 91
- - Total Registered Contacts: 3,272
- - Total Accounts: 2,658
- - Firms Using Alternatives: 71 or 78%
- - Total AUM Added by New Firms: $34.4 billion+
Accounts Breakdown
The FINTRX RIA dataset saw a significant addition of discretionary accounts to our dataset in January, making up 93% of new accounts added.
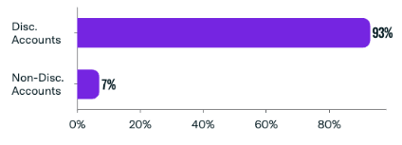
- - Total Accounts Added: 2,658
Contact Breakdown by Rep Type
A majority (81%) of newly added RIA representatives are registered as broker-dealers. Smaller segments included those registered as investment advisors at 12% while owner-only and dually registered contacts made up a combined 7%.
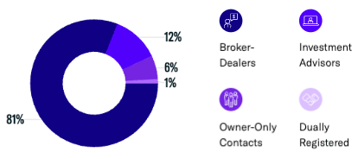
- - Broker-Dealers: 2,656
- - Investment Advisors: 380
- - Owners: 203
- - Dually Registered: 33
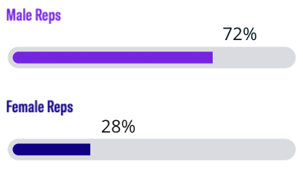
Rep Gender Breakdown
The gender breakdown of RIA representatives refers to the proportion of male and female registered advisors. As you can see below, 72% of reps added in January are male while 28% are female.
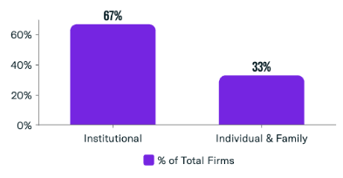
RIA Client Base Breakdown
The newly added RIA firms added to FINTRX in January show that 67% of their client base is institutional, while individual and family clients account for roughly 33%.
Firm Size by Assets Under Management (AUM)
The size of an RIA firm can be measured by its assets under management (AUM), or the total value of assets the firm oversees on behalf of its clients. In January, a majority (31%) of newly added RIA firms fall under the 'micro' category, managing assets between $1 and $25 million.
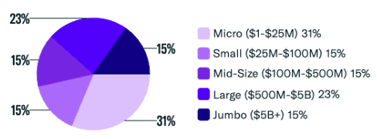
- - Micro ($1-$25M): 31%
- - Small ($25M-$100M): 15%
- - Mid-Size ($100M-$500M): 15%
- - Large ($500M-$5B): 23%
- - Jumbo ($5B+): 15%
RIA Services Provided
Of the new RIA firms incorporated into the FINTRX RIA dataset, 67% offer portfolio management for individuals and small businesses, while 54% provide financial planning services. It is important to note that RIA firms typically offer more than one service.
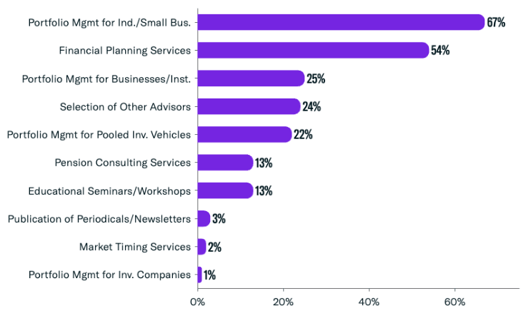
Top RIA Services Provided:
- 1. Portfolio Management for Individuals/Small Businesses: 72%
- 2. Financial Planning Services: 58%
- 3. Portfolio Management for Businesses/Institutions: 22%
- 4. Selection of other Advisors: 25%
- 5. Portfolio Management for Pooled Investment Vehicles: 14%
- 6. Pension Consulting Services: 10%
- 7. Educational Seminars/Workshops: 14%
- 8. Publication of Periodicals/Newsletters: 2%
- 9. Market Timing Services: 1%
- 10. Portfolio Management for Investment Companies: 1%
Alternative Investments Utilized
72% of newly-added RIA firms displayed some allocation to real estate within their investment portfolios. A smaller fraction displayed interest in private placements, hedge funds, private equity and REITs, among various other alternative investments.
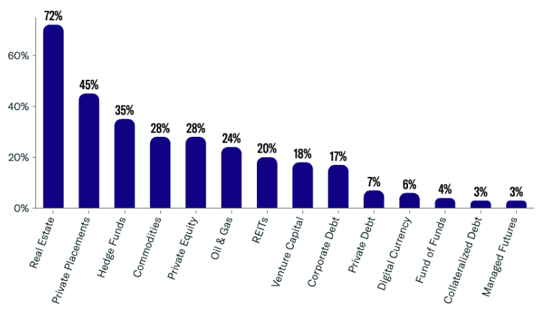
- - Real Estate: 68%
- - Private Placements: 45%
- - Hedge Funds: 37%
- - Private Equity: 23%
- - Commodities: 22%
- - Venture Capital: 18%
- - Oil & Gas: 18%
- - REITs: 16%
- - Digital Currency: 11%
- - Corporate Debt: 11%
- - Fund of Funds: 5%
- - Private Debt: 4%
- - Collateralized Debt: 3%
- - Managed Futures: 2%
FINTRX Overview
FINTRX is a unified data & research platform providing comprehensive data intelligence on 850,000+ family office & investment advisor records, each designed to help asset-raising professionals identify, access & map the global private wealth ecosystem. FINTRX data intelligence covers nearly 4,000+ family offices, 21,000+ family office contacts, 40,000+ registered investment advisor entities, and 750,000+ registered reps. Data for every record within FINTRX is pooled from 10+ public & private sources.

Equipped with 375+ search filters and numerous customization options, FINTRX allows you to seamlessly track where family office & investment advisor capital is flowing, uncover allocation trends, break down investments by sector & size, understand future investment plans and much more.


Copyright © 2026 FINTRX, Inc. All Rights Reserved. 18 Shipyard Drive Suite 2C Hingham, MA 02043 Data Privacy Policy
.png?width=367&height=109&name=ezgif.com-gif-maker%20(3).png)