
Over the last few months, the family office landscape has experienced continued growth and expansion, as did the FINTRX Family Office & RIA Data Platform. Throughout Q2, our data set grew to include 3,350+ family offices, 19,000+ decision-makers, and nearly 24,000 tracked investments, among many other updates and additions. Continue reading for a full breakdown of all new family office platform updates and additions throughout Q2 of 2022...
Introduction
Family offices are typically private unregulated companies, constructed to manage the wealth and investments of individuals and families with over $50M of investable assets. Because family offices make investment decisions based on a unique combination of considerations, FINTRX makes it easy for you and your team to identify and create relationships with the right investors. By providing credible family office intel, capital raising tools and savvy search capabilities, FINTRX continues to bring transparency to the alternative investment industry and private capital markets.
This report was produced using the FINTRX Family Office & RIA Data Platform. A multifaceted, bottom-up method was used to harvest the research from an array of sources. This practice comprises aggregating information from several public filings, proprietary data sources, strategic industry relationships, and data mapping - among other origins.
Note from our VP of Research
Dear Reader,
First, I would like to thank you for taking the time to read through our Q2 Data Report on the family office landscape. This report provides a high-level synopsis of the global family office landscape throughout Q2 of 2022 with data compiled using the FINTRX Family Office & RIA Data Platform.
As the family office market continues to shift, our research team remains dedicated to providing the most actionable and up-to-date investor data possible.
Thank you again for reading our Q2 Report and we look forward to working with you in the near future.
- Dennis Caulfield, VP of Research, FINTRX
Q2 FINTRX Updates & Additions
- - New Family Offices Added: 163
- - New Family Office Contacts Added: 1,500+
- - Newly Tracked Family Office Investments: 3,200+
- - Total Family Offices Updates: 5,600+
- - Total Family Offices Contacts Updated: 4,800+
- - Total Family Office Additions: 4,900+
- - Total Family Office Assets Added: $314.4B+
- - Total Material Changes & Updates: 21,000+
Family Office Updates & Additions by Month
Since the beginning of the year, our research team has added 275 new family offices and 2,850 new family office contacts to our dataset. Additionally, there were 9,300+ updates made.
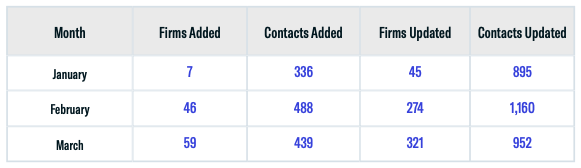
Q1 Family Office Platform Updates & Additions
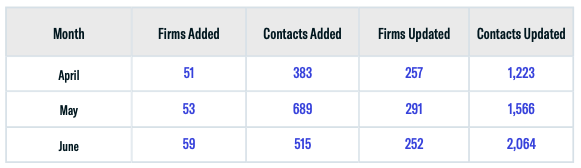
Q2 Family Office Platform Updates & Additions
Single-Family Office vs Multi-Family Office Breakdown
Throughout the course of Q2, FINTRX added a total of 163 new family office entities. Of those newly added firms, 56% are single-family offices and the remaining 44% are multi-family offices.
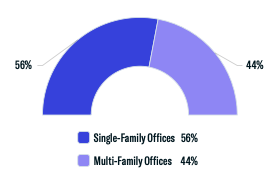
- - New Single-Family Offices: 92 (56%)
- - New Multi-Family Offices: 71 (44%)
Asset Class Interest Breakdown
We define family office asset class interest as being one or more of the following classifications. As you can see below, 88% of family offices added in Q2 show a tendency to invest in private equity, and 81% chose the direct route. Real estate and venture capital followed at 60% and 42%, respectively. Less than half showed interest in hedge funds, fund of funds, and long-only funds.
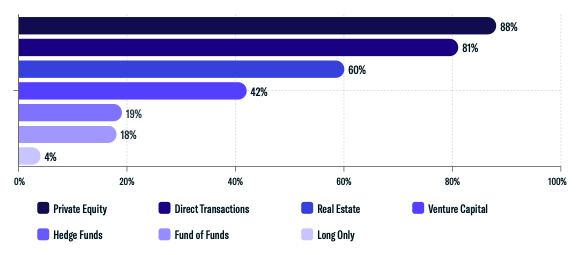
Because alternative asset classes generally allow for both wealth preservation and asset growth, we see family offices using alternative asset classes regularly.
- - Total FO Assets Added in Q2: $314.4B+
Assets Under Management (AUM)
The chart below outlines the assets under management ranges of new family offices added to our dataset throughout Q2. The most prevalent among this sample size are groups with assets above 5B+ at 39%. Family offices with AUM between $2B-$5B followed at 17%.
-1.png?width=280&name=Assets%20Under%20Management%20(AUM)-1.png)
SFO Origin of Wealth Analysis
One of the more prevalent patterns drawn from our research is the connection between the industry of wealth origin and the industry of investment interest. With that said, there is a clear tendency for groups to invest in opportunities throughout familiar industries.
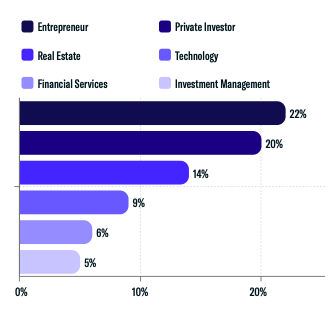
A majority of single-family offices (SFOs) added to our data set in Q2 created their wealth as entrepreneurs, private investors or through real estate ventures. It's important to note that family offices can have more than one origin of wealth.
Geographical Breakdown
Geographically, our dataset's continued growth in Q2 coincided with the increase of single and multi-family offices worldwide. Here, you can see that 48% of newly added family offices are domiciled in North America and 34% are headquartered in Europe. Asia and the Middle East accounted for 13% of newly added groups.
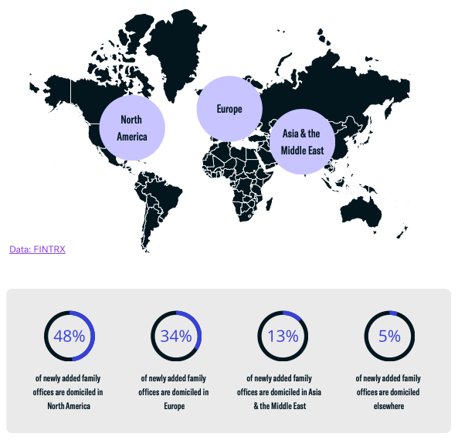
- - North America: 48%
- - Europe: 34%
- - Asia/Middle East: 13%
- - Rest of World: 5%
Direct Transactions by Sector
Throughout our research, we continue to see family offices harnessing direct investment opportunities. The shift toward direct investments is often based on the desire to have greater control over decisions relating to asset allocation. Direct transactions allow family offices to invest in or buy companies of a preferred size or industry which often leads to greater fruition down the road.
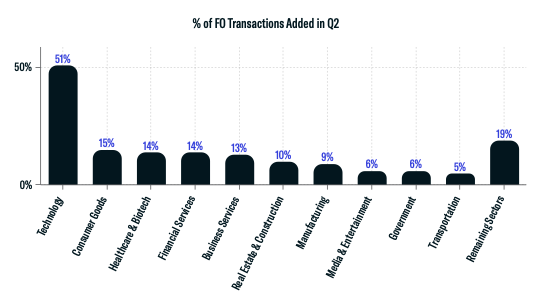
Technology remained the leading industry for family office investments at 51%, with 1,600+ transactions made into private tech companies throughout the quarter. 15% of groups directly invested in the Consumer Goods industry, while 14% targeted startups in the Healthcare & Biotechnology space. Other notable sectors include Financial and Business Services, Real Estate & Construction, Manufacturing, Media & Entertainment, Government, and Transportation.
- - Newly Tracked Family Office Investments in Q2: 3,214
Download the Report

FINTRX provides comprehensive data intelligence on 850,000+ family office & investment advisor records, each designed to help you identify, access, and map the private wealth ecosystem. Explore in-depth dossiers on each family office and investment advisor. Access AUM, source of wealth, investment criteria, previous investment history, sectors & industries of interest, and advisor growth signals amongst other key data points.
Additionally, FINTRX provides insight and expansive contact information on 850,000+ decision-makers, featuring job titles, direct email addresses, phone numbers, common connections, alma maters, past employment history, brief bios & much more.
For an in-depth exploration of the FINTRX family office platform, request a demo below.


Copyright © 2026 FINTRX, Inc. All Rights Reserved. 18 Shipyard Drive Suite 2C Hingham, MA 02043 Data Privacy Policy
.png?width=367&height=109&name=ezgif.com-gif-maker%20(3).png)