
Over the course of Q1, the family office landscape experienced continued growth and expansion, as did the FINTRX Family Office & Registered Investment Advisor (RIA) Data Platform. From January to March, the FINTRX data set grew to include 3,200+ unique family offices, 18,150+ family office contacts, 22,500+ tracked family office investments, and much more. To showcase this model of growth, we have compiled a breakdown of all new and updated family office data from Q1 2022.
Note from our VP of Research
Dear Reader,
On behalf of the FINTRX team, I would like to thank you for taking the time to review our Q1 2022 Family Office Data Report. The past quarter has been one of continued growth across the entire FINTRX platform.
As the family office space continues to expand and shift, our research team remains dedicated to providing the most actionable and up-to-date investor data possible. The result has been a substantial increase in overall family office data additions, updates and alterations since the beginning of the year. This growth comes as a result of the ongoing increase in research personnel and resources.
While we are incredibly proud of the progress we have made over the past few months, we intend on building upon these accomplishments and continuing to drive value for our global suite of FINTRX users.
Thank you again for taking a few minutes to review our report and we look forward to the opportunity to work with you.
Introduction
In continuing our mission to provide the most robust insight on single and multi-family offices, we are excited to release this Q1 2022 Family Office Data Report outlining a number of family office data trends and notable investment activity within the private wealth space.
Industry-leading financial firms leverage our powerful algorithms and expansive research team to better access the complex and rapidly changing private wealth ecosystem. In providing continuously updated family office data, capital raising tools and savvy search capabilities, FINTRX continues to bring transparency to the alternative investment industry and private capital markets.
This report has been produced exclusively utilizing the FINTRX Family Office & RIA Data & Research Platform. Thanks to our dedicated research team - who work every day to update and expand our data set - we can share credible information regarding family offices and the private wealth landscape at large.
Q1 2022 Key Data Points
- - New Family Offices Added: 115
- - New Family Office Contacts Added: 1,400+
- - New Direct Transactions that Occurred in Q1: 1,525+
- - Total Family Offices Updated: 800+
- - Total Family Offices Contacts Updated: 4,150+
- - Total News Articles Added: 9,600+
- - Total Family Office Assets Added: $215B+
- - Total Material Changes & Updates: 20,000+
Single-Family Office vs Multi-Family Office Breakdown
Throughout the course of Q1, the FINTRX Data Platform added a total of 115 new single and multi-family office entities.
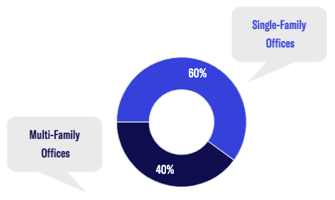
- - New Single-Family Offices: 69 (60%)
- - New Multi-Family Offices: 46 (40%)
Asset Class Interest Breakdown
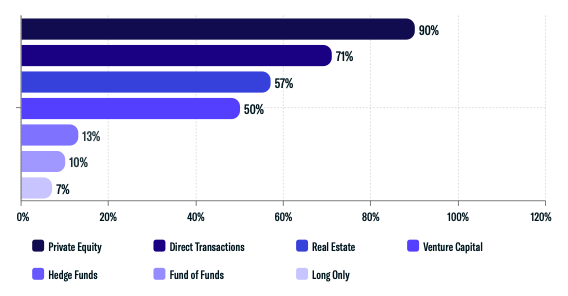
Because alternative asset classes generally allow for both wealth preservation and asset growth, we regularly see family offices harnessing alternative asset classes. We define family office asset class interest as being one or more of the following classifications. As you can see in the chart below, 90% of new family offices added to the FINTRX platform in Q1 show a tendency to invest in private equity, while 71% choose to do so via direct transactions. Real estate and venture capital followed, at 57% and 50%, respectively. Less than half showed interest in hedge funds, fund of funds, and long-only funds.
Assets Under Management (AUM) Breakdown
The following chart outlines the assets under management (AUM) breakdown of new family offices added to our dataset throughout Q1.
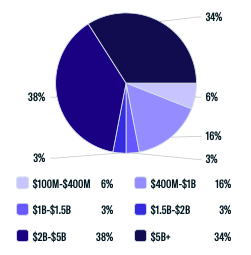
The most prevalent among this sample size are those with AUM between $2B-$5B, at 38%, followed by those with assets above 5B+, at 34%. 16% of family offices have AUM between $400M-$1B. The remaining AUM ranges make up less than 12%. In total, our data team added $215 billion of family office assets to our data set.
SFO Origin of Wealth Breakdown
Several variables play a role in the types of investments family offices make. One of the more prevalent patterns drawn from our research is the connection between the industry of wealth origin and the industry of investment interest. With that said, there is a clear tendency for groups to invest in opportunities throughout familiar industries.
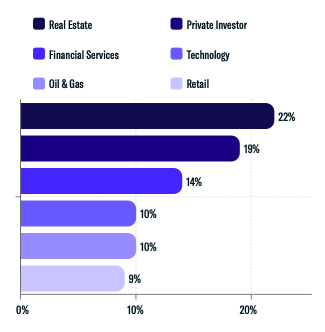
The chart above demonstrates that a majority of single-family offices added to our data set in Q1 created their wealth through Real Estate ventures, as private investors, or in the financial services industry. It's important to note that family offices can have more than one origin of wealth.
Geographical Breakdown
Geographically, the FINTRX data set's expansion in Q1 coincided with the increase of single and multi-family offices globally. Here, you can see that 51% of newly added family office entities are domiciled in North America. Europe and the Middle East follow at 35% and 10%, respectively. The rest of the world makes up the remaining 4%.
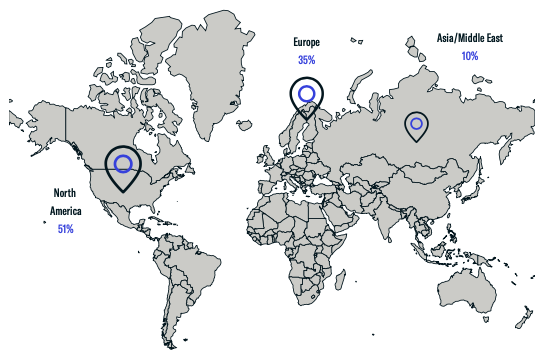
- - North America: 51%
- - Europe: 35%
- - Asia/Middle East: 10%
- - Rest of World: 4%
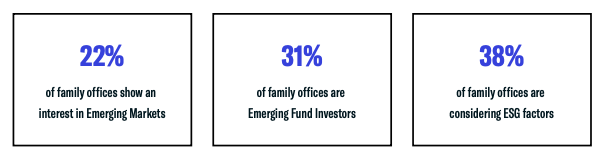
Family Offices Investing in ESG
Several indicators highlight the trend of family offices increasing allocations to ESG-focused funds and companies. Research suggests that ESG investing is not only socially responsible but fiscally advantageous. With that said, we continue to see private wealth groups modeling their investment strategies with an emphasis on sustainability and ethics. Below we display the percentages of newly added family offices considering ESG factors, groups that are emerging fund investors, as well as those with an interest in emerging markets.
Direct Transactions by Sector
Throughout our research, we continued to observe family offices harnessing direct investment opportunities. Direct transactions are an optimal route for family offices as they allow them to focus on buying companies of a preferred size or industry. This ultimately ensures greater control and transparency in regards to their capital allocation.
Technology remained the leading industry for family office investments at 38%, with 570+ transactions made into private tech companies throughout the quarter. 16% of newly added family offices made direct investments into the Financial Services industry while 16% targeted companies in the Real Estate & Construction landscape.
Additional sectors of interest include Consumer Goods at 15%, Healthcare & Biotechnology at 14%, and Manufacturing at 13%. Other notable industries tracked include Business Services, Media & Entertainment, Transportation, Leisure & Lifestyle, Energy & Utilities, Education, Government, Human Services, and Hospitality.
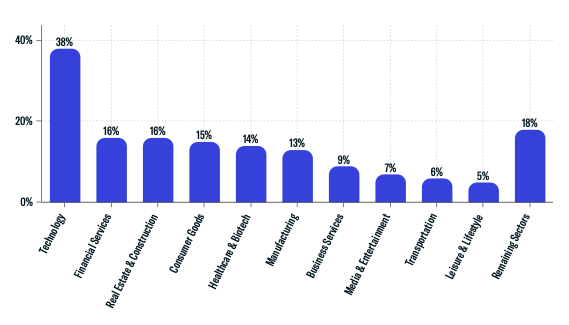
- - Technology: 38%
- - Financial Services: 16%
- - Real Estate & Construction: 16%
- - Consumer Goods: 15%
- - Healthcare & Biotech: 14%
- - Manufacturing: 13%
- - Business Services: 9%
- - Media & Entertainment: 7%
- - Transportation: 6%
- - Leisure & Lifestyle: 5%
- - Remaining Sectors: 18%
Download the Report

FINTRX provides comprehensive data intelligence on 750,000+ family office & investment advisor records, each designed to help you identify, access, and map the private wealth ecosystem. Explore in-depth dossiers on each family office and investment advisor. Access AUM, source of wealth, investment criteria, previous investment history, sectors & industries of interest, and advisor growth signals amongst other key data points.
Additionally, FINTRX provides insight and expansive contact information on 750,000+ decision-makers, featuring job titles, direct email addresses, phone numbers, common connections, alma maters, past employment history, brief bios & much more.
For an in-depth exploration of the FINTRX family office platform, request a demo below.


Copyright © 2026 FINTRX, Inc. All Rights Reserved. 18 Shipyard Drive Suite 2C Hingham, MA 02043 Data Privacy Policy
.png?width=367&height=109&name=ezgif.com-gif-maker%20(3).png)