
FINTRX, the leading private wealth data intelligence platform, is pleased to release the Q1 FINTRX Private Wealth Data Report. This report serves as a high-level synopsis of the global investment advisor and family office landscapes and investment trends throughout the first quarter of 2024 with data compiled using the FINTRX Family Office & RIA Data Platform. Continue reading to explore data-driven insights on the family office and registered investment advisor ecosystems as well as an overview of all FINTRX platform updates and additions made throughout the quarter.
Download the Report

Introduction
Welcome to the Q1 2024 FINTRX Private Wealth Data Report: a high-level synopsis of the global investment advisor and family office landscapes and investment trends throughout Q1 featuring data compiled from the FINTRX Family Office & RIA Data Platform.
As the leading provider of family office and registered investment advisor industry intelligence, FINTRX is fully dedicated to delivering the most comprehensive and accurate industry data available. As these private wealth vehicles continue to gain traction, we empower individuals to connect with investors, identify suitable opportunities and ultimately navigate the private wealth ecosystem with confidence.
All research and insights contained within this report are compiled from our extensive RIA and family office dataset - built through a combination of proprietary research, data partnerships and advanced algorithms. Our team of 75+ researchers work tirelessly to ensure that our data is accurate and up-to-date, providing clients with a reliable and trusted resource for their investment needs.
We hope the data and perspectives contained within this report will empower you to make informed decisions as you navigate the intricate ecosystem of private wealth management.
Note From Our VP of Research
Dear Reader,
The FINTRX data and research team has commenced 2024 with its most robust quarter to date. I am thrilled to present the Q1 2024 Private Wealth Data report, outlining the additions and updates made to our comprehensive family office and registered investment advisor data.
The FINTRX team remains committed to providing our clients across the financial industry with the most cutting edge data intelligence throughout the private wealth landscape. While we are incredibly proud of the progress we have made with substantial data additions and updates, we will continue to build upon these accomplishments and drive further value for our global suite of FINTRX users.
I'd to express our gratitude for your ongoing trust in our team as your resource for family office and investment advisor research and data. We value your partnership above all else and will continue to strive for excellence to ensure you always have access to the most accurate and actionable data possible.
Should you have any questions about the data or wish to delve deeper into the report, please reach out to our team. Our goal, as always, is to support your success in navigating the complex realm of private wealth.
Thank you again for taking a few minutes to review our latest report.
Warm Regards,
Dennis Caulfield, Vice President of Research
Family Office Data
Q1 Family Office Platform Updates & Additions
- New Family Offices Added: 125+
- New Family Office Contacts Added: 2,030+
- Tracked Family Office Investments Added: 1,280+
- Total Family Office Additions: 2,150+
- Total Family Office Assets Added: $250.2 Billion+
- Family Office Firm Updates: 1,520+
- Family Office Contact Updates: 10,890+
Total Family Office Updates & Additions Made in Q1: 14,570+
Family Office Overview
Single Family Offices vs Multi-Family Offices
Single family offices (SFOs) are private wealth management firms created by high-net-worth individuals & families to provide completely customized and unique financial & investment services for that family. Multi-family offices (MFOs) provide similar services to a group of clients, using shared resources to streamline costs and provide a more standardized approach to wealth management.
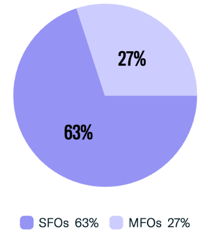
129 family offices were added to FINTRX in Q1. This chart shows the percentage breakdown of SFOs vs MFOs, with the majority of firms (63%) being single family offices.
Assets Under Management (AUM)
Assets under management refers to the total value of assets that a family office manages on behalf of their clients, which can include a wide variety of assets such as stocks, real estate, private equity, hedge funds and other alternatives. AUM can vary greatly amongst family offices, depending on the number of families they serve and their cumulative net worth.
The graph below displays the AUM ranges (in USD) for family offices added in Q1. The majority (54%) of firms added manage over $1B in assets, with over 22% managing more than $5B.
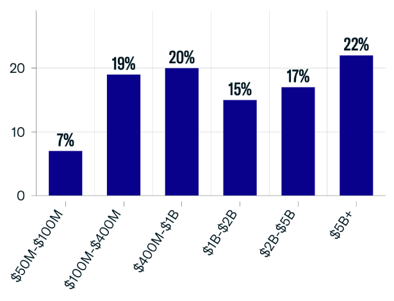
Total Family Office Assets Added to FINTRX in Q1: $250.2 Billion
Asset Class Interest
Family offices generally demonstrate a significant interest in investing across various asset classes. Alternative assets provide an efficient means of portfolio diversification and serve as a valuable counterbalance to traditional investments, offering a measure of insulation from economic downturns.
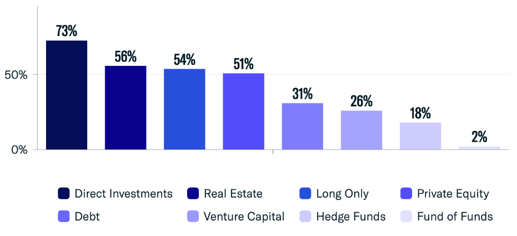
Family offices showed a significant focus on direct investments into private companies, with 73% of firms added in Q1 displaying interest. FINTRX data also shows an increased interest in long only/traditional investments (up from 26% in Q3 2023), and a decrease in hedge fund activity (down from 35% in Q3 2023).
Single Family Office Wealth Origin
There is often strong correlation between the industry from which a family office's wealth originates and the industries of their investment activity. This phenomenon can be attributed to the individual or family's unique expertise with that particular industry and a desire for continued involvement in an industry that has driven their past success.
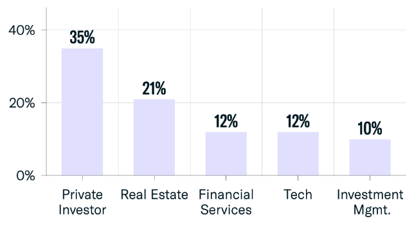
For single family offices added in Q1, the most common wealth origins were private investing and real estate.
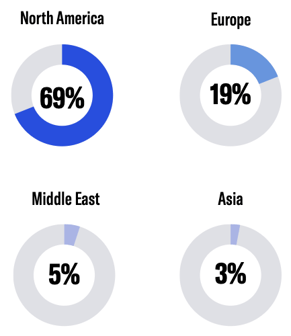
Geographic Breakdown
Here, we explore the distribution of the family offices that were added to the FINTRX platform for the quarter. The consistent growth of our Family Office dataset reflects the increasing numbers of family offices worldwide.
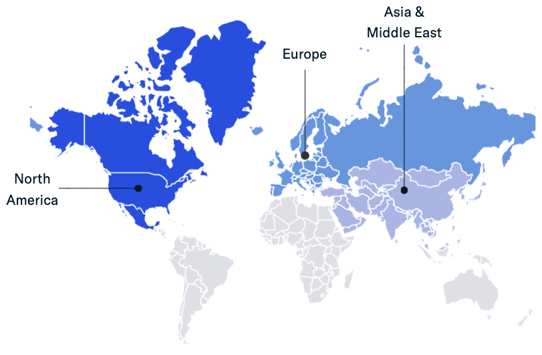
The large majority of family offices added in Q1 are located in North America, accounting for almost 70% of firms.
In contrast to previous quarters, numbers of family offices located in Asia & Middle East, Latin America and Oceania were notably low, making up only 11% of all new family offices. Europe continues to be the second-most popular region for family offices, accounting for 19% of firms. While numbers of family offices throughout the various global regions are constantly in flux, North America continues to host the overwhelming majority of firms worldwide.
As the family office sphere continues to grow, we anticipate seeing these numbers fluctuate quarter over quarter.
Family Office Direct Investments
We continue to see family offices harnessing direct investment opportunities, often motivated by a desire for more power over asset allocation decisions and a more hands-on approach with the business operations of the companies in which they invest. Direct investments can be both a challenging and rewarding method of portfolio diversification, and despite the continuation of market turbulence and uncertainty, family offices continue to make such investments, leaning on innovation to drive success. The graph below depicts the top ten sectors in which family offices made direct investments throughout Q1.
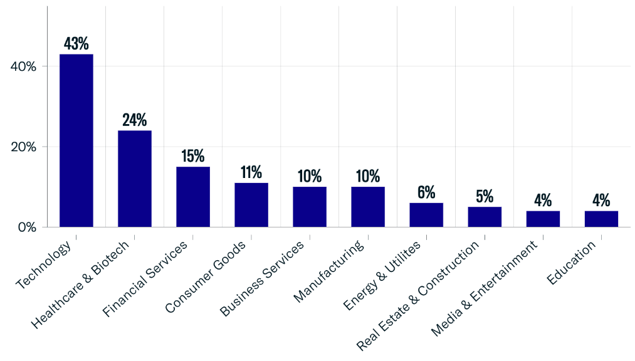
Unsurprisingly, technology remains the leading industry for direct family office investments, making up 43% of tracked transactions throughout the quarter. This translated to roughly 550 transactions made into private technology companies. As technological innovation continues to drive the global economy, we will continue to see substantial private capital flow into emerging tech companies.
Family offices continue to show increased interest in healthcare & biotech, with transactions into the sector up to 24% in Q1 from 18% in Q3 2023. Real estate & construction investment activity has taken a hit in the beginning of 2024, falling to just 5% of transactions from 12% in Q3 2023.
New Family Office Direct Investments Tracked in Q1: 1,280
Registered Investment Advisor (RIA) Data
RIA Overview
A registered investment advisor (RIA) is an individual or firm registered with the SEC or State Securities authorities that advises or manages investments on behalf of individuals or institutions, following a fiduciary standard to act in the clients' best interests.
The term 'RIA' can refer to many different types of entities, from banks to hedge funds to traditional wealth managers. For the purpose of this report, we do not include data on firms exclusively registered as broker dealers.
As global wealth rises and the U.S. economy experiences consistent turbulence post-pandemic, the demand for RIA services has grown. More and more, we see individuals and institutions turning to these entities to assist in managing capital and to provide advice for those who feel unequipped to successfully navigate today's complex investment terrain.
FINTRX RIA Data Coverage
The FINTRX registered investment advisor dataset covers nearly 40,000 registered entities, 32,000+ RIA firms, 17,000+ private wealth groups and 750,000+ registered reps with in-depth data on investment trends, AUM & accounts, 13F holdings, private funds and more.
Total RIA Firms in Q1 (including firms dually registered as RIA & broker dealer): 32,280+
Total Investment Advisor Reps in Q1: 403,000+
Assets Under Management (AUM)
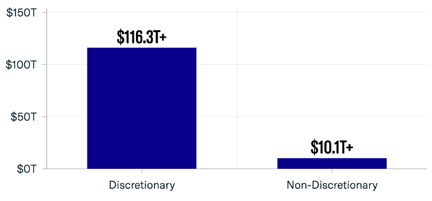
The chart below depicts the breakdown of managed assets on a discretionary vs. non-discretionary basis. In Q1, 92% of assets managed were discretionary, allowing advisors to make investment and allocation decisions on behalf of their clients. Only 8% of client assets were managed on a non-discretionary basis.
-
Total AUM (including firms dually registered as RIA & broker dealer): $126.5 Trillion+
-
RIA Total AUM: $119 Trillion+
Firm Size by Assets
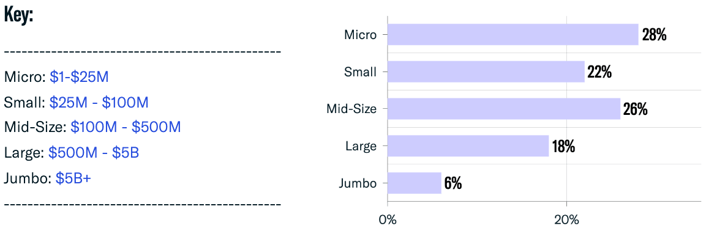
Here we provide a breakdown of the size of RIA firms based on their total managed assets. The large majority of registered entities managed less than $500 million in assets in Q1, with 50% of firms managing less than $100 million. 'Jumbo' firms with over $5 billion in AUM accounted for a mere 6% of the RIA ecosystem.
Account Breakdown
Here we provide an analysis of discretionary vs. non-discretionary accounts for RIAs in Q1 with both number and percentage breakdowns. Q1 saw a slight decrease in total number of RIA-managed accounts by about 100,000.
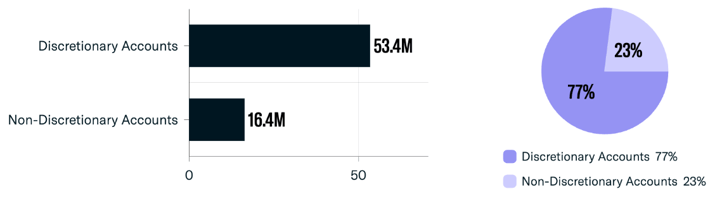
Total Accounts: 69.8 Million+
Alternative Investments
Incorporating alternatives into client portfolios is a common strategy to diversify portfolios, mitigate risk, and pursue potentially higher returns compared to traditional investments. These alternative assets are typically less correlated with the stock market, which helps reduce vulnerability to market volatility and fluctuations. The graph below shows a breakdown of the top ten most common alternative investments utilized by RIAs in Q1, with the majority of entities (71%) continuing to show interest in real estate investments.
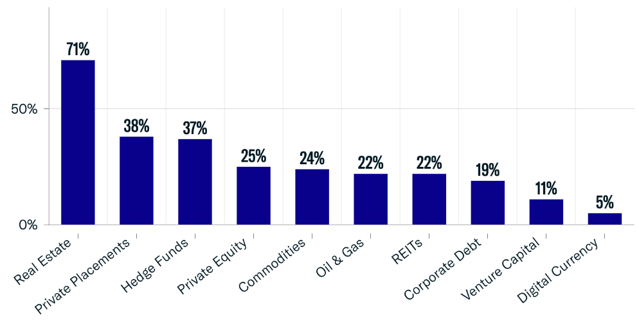
Firms Active in Alternatives: 25,300+
Geographic Breakdown
Because RIAs by definition are entities registered with US-based governing bodies, the majority of HQ offices for RIAs are concentrated in and around major cities across the United States. Unsurprisingly, New York and California are the largest hubs for RIAs, as they house the two largest, wealthiest metropolitan areas in the country. Here, we analyze the registered investment advisor landscape by HQ location, including the top states by both total managed assets and firm count.
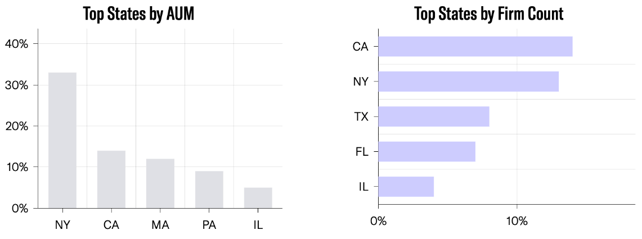
The United States accounts for about 96% of registered investment advisor firms and 90% of total global RIA assets, or roughly $114 trillion.
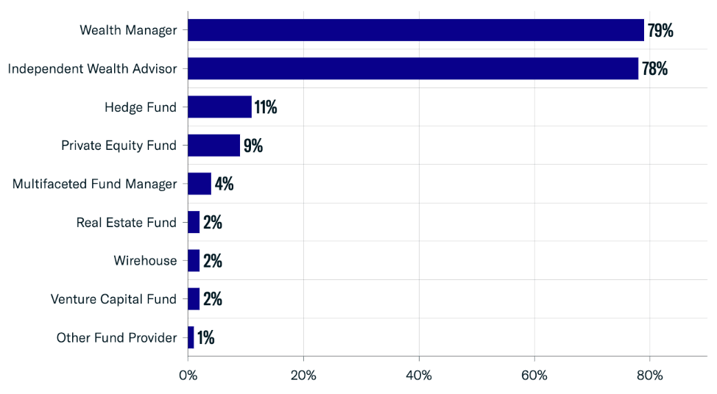
Firm Classifications
FINTRX uses proprietary algorithms to classify registered firms based on their business activities. Individual entities may have several classifications if they offer multiple different types of services to their clients. Our advanced platform offers users the capability to filter RIAs based on these classifications, enabling more efficient market research and prospecting.
Here we provide a breakdown of the most common classifications of investment advisor firms throughout Q1, with the large majority classified as wealth managers and/or independent wealth advisors.
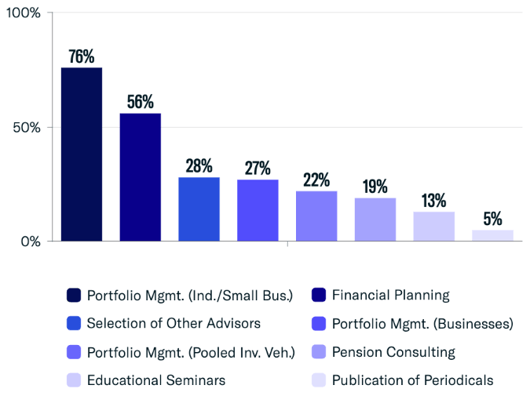
Services Provided
RIA firms, especially larger firms, often provide a wide variety of services to their clients, from portfolio management to financial planning to tax management.
The graph below depicts the most common services offered in Q1. As usual, the most common service offered was portfolio management for individuals/small businesses at 76%, followed by financial planning at 56% and selection of other advisors at 28%.
Fee Structures
RIAs offer a variety of different fee frameworks based on the services they offer or their target client type. The most common fee structures are some combination of percentage of AUM, fixed rates, or hourly charges. Fees based on AUM usually fall between 0.25% and 2.00%, contingent on the account size.
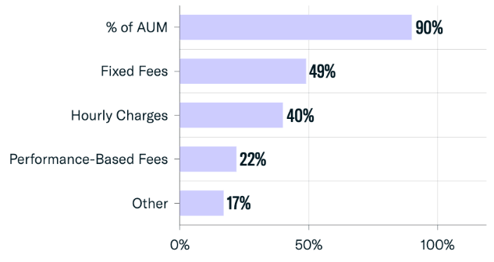
The most common fee structure among firms in Q1 was a set percentage of managed assets (90%), followed by fixed fees (49%), hourly rates (40%) and performance-based fees (22%). Other fee types may include commissions or subscription-type fees.
Separately Managed Account (SMA) Asset Allocation
Separately managed account (SMA) asset allocation refers to the breakdown of assets held of behalf of clients excluding other investment companies, business development companies and pooled investment vehicles. These SMAs are made up of various asset types, most commonly exchange-traded equities, such as stocks and ETFs, and cash or cash equivalents.
The use of SMAs offers more flexibility and customization of investment strategies, and as a result, may include higher management fees.
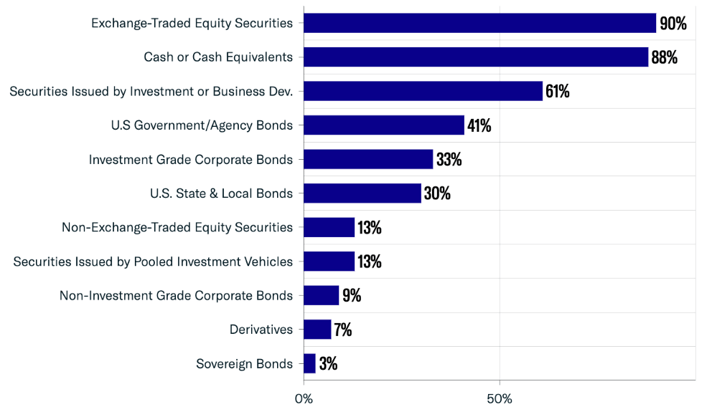
Through Q1, 90% of RIAs utilized exchange-traded securities and 88% maintained cash or cash equivalents. The other most commonly utilized SMA assets throughout the quarter included securities issued by investment or business development companies, U.S. government agency bonds, and investment grade corporate bonds. Q1 also saw an increase in U.S. government agency bonds, up to 41% from 39% in Q3 2023.
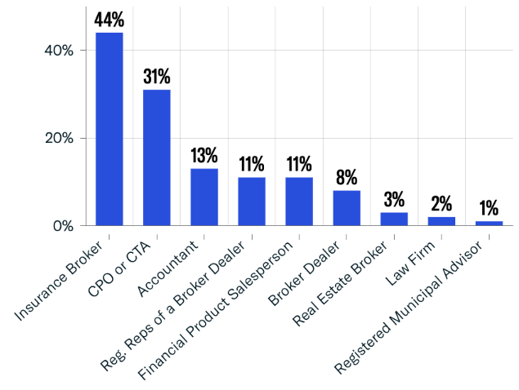
Business Activities
RIAs often provide a variety of business services beyond wealth management or asset allocation in order to offer their clients a comprehensive suite of financial services.
Insurance brokering continues to be the most common activity, accounting for 44% of these additional operations, and commodity pool operations (CPO) or commodity trading advising (CTA) accounted for 31% of such activities.
Contact & Rep Breakdown
FINTRX provides data on over 750,000 registered reps and associated contacts active in the RIA & broker dealer space. Below is an analysis of the contacts covered by our dataset in Q1, with a breakdown of reps by registration type and by gender. Though shown through only slight changes quarter over quarter, we continue to see a steady increase in the numbers of female industry professionals, who now account for 27% of reps.
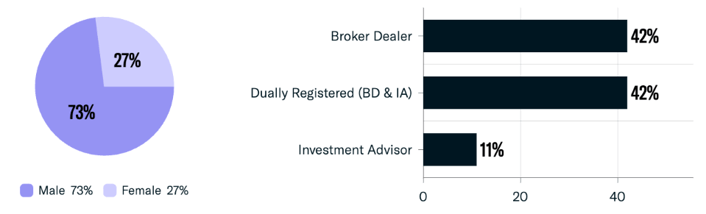
Total Platform Contacts: 752,000+
FINTRX Private Wealth Market Intelligence
FINTRX is a unified data and research platform providing comprehensive data intelligence on 850,000+ family office & investment advisor records, each designed to help asset-raising professionals identify, access and map the global private wealth ecosystem.
FINTRX data covers over 4,000 family offices, 20,000+ family office contacts, 40,000+ investment advisor entities, 17,000+ private wealth groups and 752,000+ registered reps & associated contacts sourced from both public and private sources. Equipped with 375+ search filters, FINTRX allows you to seamlessly track the flow of private capital, uncover allocation trends, and break down investment data.
FINTRX provides in-depth dossiers on each family office and investment advisor, allowing asset-raising professionals to access AUM & account data, sources of wealth, investment criteria, past investments made, advisor growth signals, sectors & industries of interest and more.
Additionally, FINTRX offers expansive contact information on 850,000+ private wealth decision-makers, featuring AI-powered relationship mapping, job titles, direct email addresses, phone numbers, common connections, past employment & education history, and extensive bios to empower you to book more meetings, increase efficiency and expand your global network.


Copyright © 2026 FINTRX, Inc. All Rights Reserved. 18 Shipyard Drive Suite 2C Hingham, MA 02043 Data Privacy Policy
.png?width=367&height=109&name=ezgif.com-gif-maker%20(3).png)