
As the leading private wealth intelligence data solution, FINTRX is excited to release the Q2 2023 Family Office & RIA Data Report, which provides a comprehensive analysis of the latest developments in the industry as well as an overview of all FINTRX platform updates and additions made throughout the quarter. This report offers a deep dive into the private wealth landscape, including data-driven insights on the family office and registered investment advisor ecosystems.
Download the Report


Introduction
We are pleased to present our latest Private Wealth Data Report, which features new and updated family office and registered investment advisor (RIA) data collected and analyzed via FINTRX throughout Q2 2023. As the premier source of private wealth data intelligence, FINTRX is committed to delivering the most exhaustive and precise information available in the industry.
This report offers a comprehensive overview of the family office and RIA ecosystems, including insights into key trends, investment preferences, geographic focus and more. Our private wealth data and research platform is engineered to assist financial entities in forging fresh opportunities and navigating the private wealth market with assurance.
Through a combination of proprietary research, data partnerships and advanced algorithms, FINTRX has built a rich and expansive database of family offices and RIAs worldwide. Our growing team of 75+ researchers work daily to ensure our data is accurate and up-to-date, providing clients with a reliable and trusted source for their investment research needs.
We aim for this report to offer key insights, assisting asset-raising professionals in making savvy and informed investment decisions in the dynamic realm of private wealth.
Note From Our VP of Research
Dear Reader,
I'm thrilled to present our most recent report on Family Office & Registered Investment Advisor (RIA) landscapes, encompassing new and revised data gathered and analyzed via FINTRX throughout the second quarter of 2023.
First and foremost, I would like to express my sincere gratitude in our valued clients for your trust and continued partnership. Your support has been invaluable in our mission to provide unparalleled data intelligence on the family office & RIA space.
We invite you to delve into the full Q2 2023 Private Wealth Data Report, as it provides an in-depth analysis of notable trends and patterns that with undoubtedly shape the industry moving forward.
At FINTRX, we remain committed to empowering asset-raising professional with the most accurate and comprehensive data intelligence available, our goal is to support your success in navigating the ever-evolving world of private wealth.
If you have any question or would like to discuss the report further, please do not hesitate to reach out. We are here to provide the guidance and support you need to thrive in this dynamic industry.
Sincerely,
Dennis Caulfield, Vice President of Research
Family Office Data
Q2 Family Office Platform Updates & Additions
- New Family Offices Added: 160+
- New Family Office Contacts Added: 1,040+
- Newly Tracked Family Office Investments: 1,070+
- Total Family Office Additions: 2,300+
- Total Family Office Assets Added: $139.4 Billion
- Family Office Firm Updates: 1,500+
- Family Office Contact Updates: 9,500+
Total Family Office Updates & Additions Made: 11,000+
Family Office Breakdown
Single-Family Offices vs Multi-Family Offices
Single family offices (SFOs) cater to the specific financial needs of an individual high-net-worth family or person with precisely tailored services, offering a personalized experience. In contrast, multi-family offices (MFOs) serve several affluent clients, using share resources to streamline costs and provide and more standardized approach to wealth management.
.png?width=289&height=217&name=Blog%20Graphics%20(2).png)
FINTRX incorporated 163 new family offices into our database. Among these additions, 55% consist of multi-family offices, while the remaining 45% are single family offices.
Asset Class Interest
Family offices generally demonstrate a broad interest in investing across various asset classes. Alternative asset categories present an attractive choice for individuals with private wealth, as they provide a means to both safeguard their wealth and achieve simultaneous asset growth.
.png?width=418&height=314&name=Blog%20Graphics%20(3).png)
Based on FINTRX data, family offices continued to show an inclination toward real estate and private equity investments throughout Q2. Direct investment into private companies was also one of the top asset classes favored by this sample size.
Assets Under Management (AUM)
Assets Under Management (AUM) refers to the cumulative value of assets that family offices handle for their clients. This encompasses a variety of assets including stocks, bonds, real estate, private equity, hedge funds and commodities, among other alternative investments. The AUM can differ greatly among family offices, depending on the wealth and size of the families they cater to.
The data provided illustrates the AUM ranges for family offices added during Q2. Over 50% of the sample size has assets between $100M and $400M as well as $400M and $1B. Firms with AUM between $2B and $5B account for just over 20% of newly added groups.
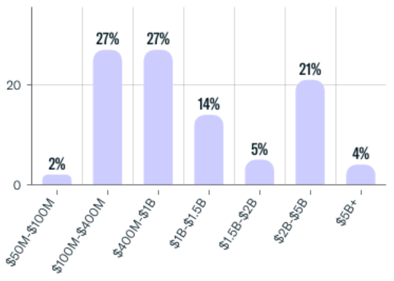
Family Office AUM Added to FINTRX in Q2: $139.4 Billion
Single-Family Office Origin of Wealth Analysis
In our analysis of the origin of wealth for single family offices (SFOs) in Q2, we discovered that most SFOs amassed their wealth primarily through financial services. Other popular sources of wealth included real estate, private investments, retail and technology.
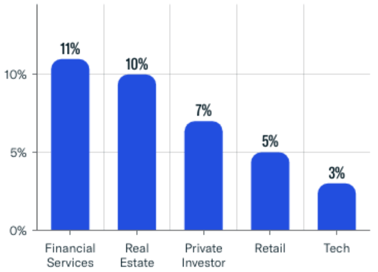
Our examination indicates that SFOs are consistently broadening their wealth sources while focusing on enduring growth and stability. It's also important to note that the wealth within a family office may be derived from a variety of origins.
Geographic Breakdown
This analysis refers to the geographic distribution of newly added family offices to our dataset for the quarter. The steady expansion of our family office dataset mirrored the worldwide growth of family offices.
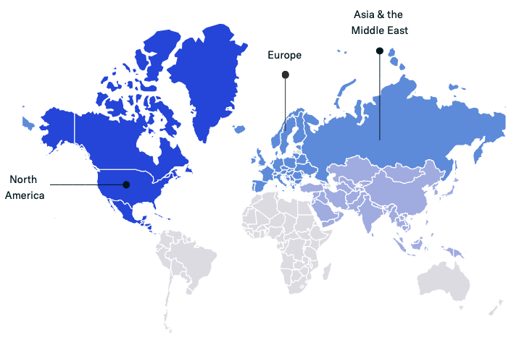
North America and Europe continue to be the key regions for family offices, collectively making up 75% of the worldwide total.


The Asia-Pacific region's steady expansion solidifies its position as the world's third-largest market for family offices. This surge is mostly fueled by the burgeoning wealth in nations such as China and India, among others. The region's strong economic development and increasing financial literacy have contributed to this upward trend.
Family Office Direct Transactions by Sector
Family offices have been elevating their direct investment endeavors across numerous sectors last quarter, empowered by unprecedented access to capital. Adopting a proactive stance, they are pursuing investment opportunities in line with their interest and principles. This trend, influenced by the desire for portfolio diversification and returns amidst a challenging market, is projected to persist throughout the year.
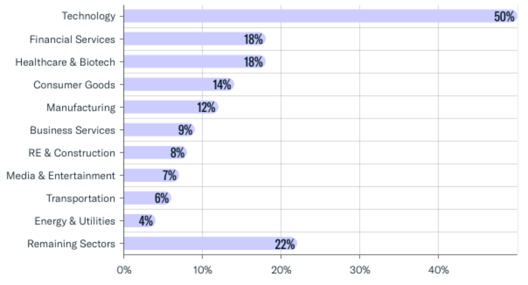
Technology held its ground as the top choice for family office investments, making up 50% of their activity in Q2. This translated to 530+ transactions made in private tech firms during the quarter, highlighting the sector's appeal for its innovation, potential for growth and ability to drive significant returns. Family offices also expressed investment interest in sectors including financial services, healthcare & biotech, consumer goods, manufacturing, business services as well as real estate & construction, among others.
Newly Tracked Family Office Investments in Q2: 1,070+
Q2 '23 Registered Investment Advisor (RIA) Data
Registered investment advisors (RIAs) are individuals or institutions registered with State Securities Authorities or the SEC to offer investment advice or asset management. They must follow a fiduciary standard, ensuring they prioritize their clients' interests.
The RIA landscape encompasses diverse entities, from banks and financial planners to hedge funds, family offices, and asset managers. It's worth mentioning that this report does not include firms exclusively registered as broker-dealers.
In recent years, the allure of RIAs has grown notably. This surge in popularity stems from a blend of reasons: the rising demand for customized financial advice, a shift towards fee-based models, supportive regulatory changes, technological advancements and the availability of a broader range of investment options, to name a few.
FINTRX RIA Data Coverage
The FINTRX registered investment advisor dataset covers data on nearly 40,000 RIA entities and almost 747,000 registered reps. It is important to note that this data is inclusive of broker dealers and dually registered reps.
Total Registered Firms in Q2 (including Dually Registered): 39,370+
Account Breakdown
Here we delve into an account breakdown of RIAs for the quarter. This analysis provides insights into the distribution and types of RIA entities registered (discretionary vs. non-discretionary accounts).
Total Accounts Registered: 70 Million+
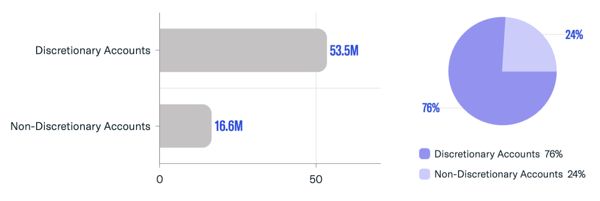
- - Total Discretionary Accounts: 53.5 Million (76%)
- - Total Non-Discretionary Accounts: 16.6 Million (24%)
Assets Under Management (AUM)
This analysis sheds light on the distribution of funds, capturing the breadth and scale of investments managed by RIAs and dually registered entities. 91% of the assets were managed on a discretionary basis, while the remaining 9% were non-discretionary. This highlights a predominant preference for discretionary asset management, where advisors make decisions on behalf of clients, compared to the non-discretionary approach where clients retain decision-making authority.
-4.png?width=599&height=198&name=Assets%20Under%20Management%20(AUM)-4.png)
- - RIA Assets Under Management: $118 Trillion+
- - Dually Registered Assets Under Management: $7.5 Trillion+
- - Total Assets Under Management: $127 Trillion+
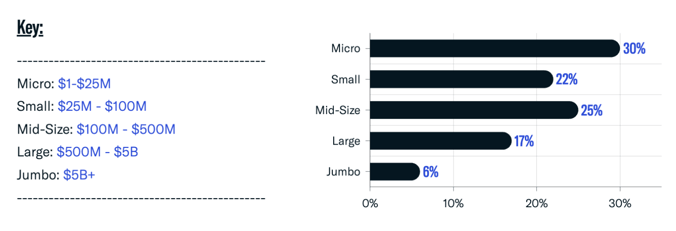
Firm Size by Assets
The chart that follows offers a distribution of registered investment advisors based on their assets under management. A majority, over 50%, of these registered entities fall under the 'Micro' category with AUM up to $25 million and the 'Mid-Size' category, having AUM ranging from $100 million to $500 million. Notably, firms with assets between $25 million and $100 million constitute 22% of the landscape.
Contact & Gender Breakdown
The contact breakdown illustrates the variety of contact categories, encompassing broker dealers (BDs), investment advisors (IAs), owners and those that may represent a combination of these types. A significant 84% are either broker dealers, often referred to as BDs, or registered as investment advisors and BDs.
Total RIA Contacts: 746,000+
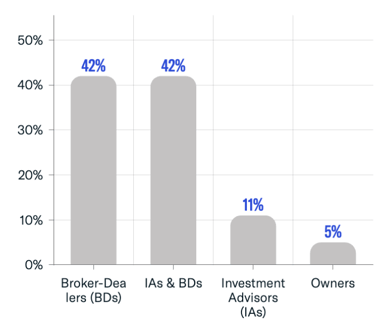
- - Broker-Dealers: 42%
- - Investment Advisors & Broker-Dealers: 42%
- - Investment Advisors: 11%
- - Owners: 5%
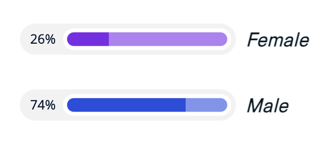
Male reps continue to dominate the field at 74%, though women are slowly lessening that gap.
- - Female Reps: 26%
- - Male Reps: 74%
Alternatives Utilized
RIAs often incorporate alternatives in client portfolios to enhance diversification, mitigate risk, and aim for higher returns compared to conventional investments. These alternatives usually display lesser correlations with the stock market, making them less susceptible to volatility during market fluctuations.
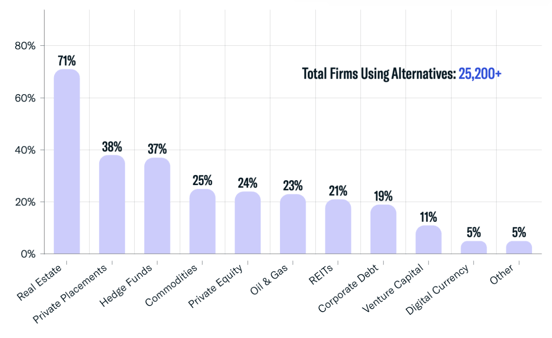
Approximately 71% of registered investment advisory firms that ventured into alternative investments directed some of their capital towards real estate. Other popular choices included private placements, hedge funds, commodities, private equity, oil & gas, and REITs.
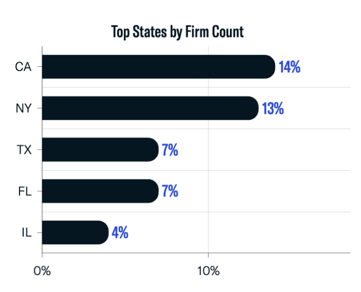
Geographic Breakdown
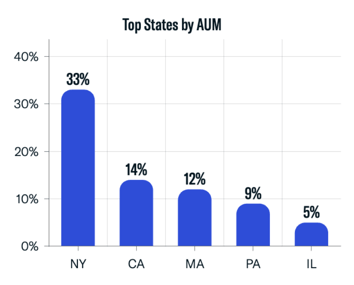
The presence of RIAs fluctuates across states or regions, with certain areas, particularly major cities, showcasing a robust RIA presence. It's evident that California and New York stand out. These states not only have the greatest number of registered firms but also boast a significant concentration in both the number of firms and the assets they manage.
New York houses 33% of the assets overseen by registered investment advisor firms, marking an 8% increase from the previous quarter. Trailing behind are California and Massachusetts, accounting for 14% and 12% of the managed assets, respectively.
The United States accounts for about 89% of registered investment advisor assets, or roughly $114 trillion.
Fee Structures
The fee framework for registered investment advisors can differ significantly based on the services offered. Commonly, RIAs set their fees as a percentage of AUM, fixed rates, or hourly charges. Fees based on AUM usually fall between 0.25% and 2.00%, contingent on the account size. On the other hand, flat fees are set for distinct services or a mix of them. The hourly charges fluctuate according to the advisor's expertise and the intricacy of the services rendered.
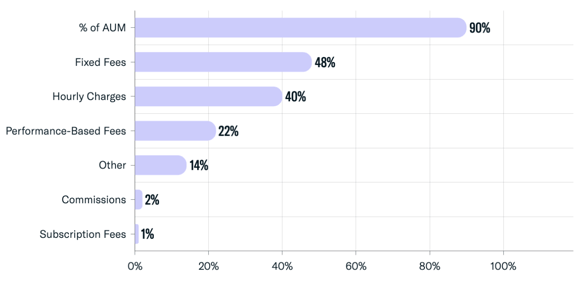
Throughout the quarter, the predominant fee structure among RIAs was based on a percentage of assets under management. Still, some opted for alternative structures, including fixed fees, hourly rates and performance-based charges for their clients.
Entity Classifications
FINTRX uses proprietary algorithms to classify RIA and Broker Dealer firms based on their business activities. Each firm might be tagged with multiple classifications, and users have the capability to filter RIAs based on these specific tags. This system streamlines market research and facilitates precise targeting within the RIA sector. Classifications include Hedge Funds, Independent Wealth Advisors, Investment Banks, Liquidity Funds and Multifaceted Fund Managers, among others.
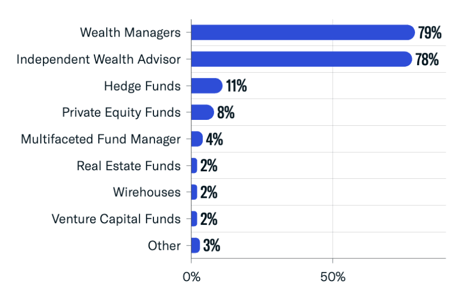
The majority of RIAs categorized themselves as either wealth managers or independent wealth advisors.
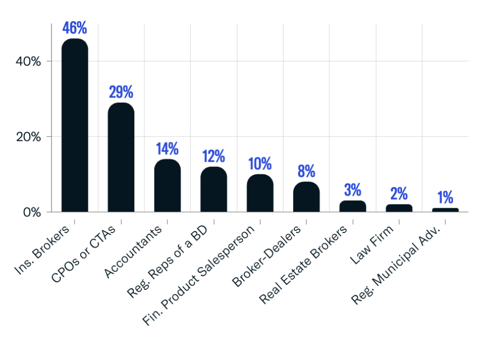
Business Activities
RIAs often engage in various business activities beyond their primary role as investment advisors. Notably, insurance brokering stands out as the most common additional activity, representing 46% of these additional operations. CPOs or CTAs followed, accounting for 29% of such activities.
Services Provided
RIAs provide a variety of services, ranging from portfolio management to financial planning to tax management. 76% of all registered firms provided portfolio management for individuals and small businesses and 55% of registered firms offered financial planning services.
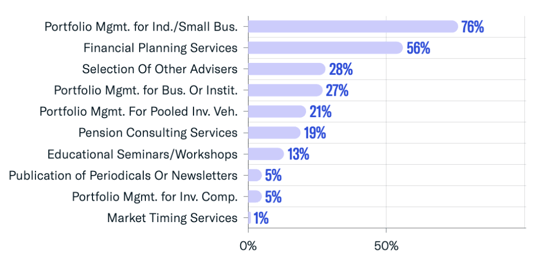
Other common services provided include the selection of other advisors, portfolio management for businesses or institutions, portfolio management for pooled investment vehicles and pension consulting services, among others.
Managed Accounts
Managed accounts allow for customization and personalization of investment strategies, as well as transparency and control to investors.
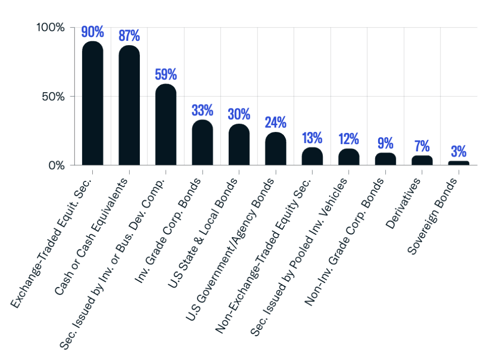
90% of companies owned exchange-traded stocks while 87% maintained cash or cash equivalents. Others utilized throughout the quarter include securities issued by investment or business development companies, investment grade corporate bonds and U.S State & Local Bonds, among numerous others.
FINTRX Private Wealth Market Intelligence
FINTRX is a unified data & research platform providing comprehensive data intelligence on 850,000+ family office & investment advisor records, each designed to help asset-raising professionals identify, access and map the global private wealth ecosystem.
FINTRX data covers 3,800+ family offices, nearly 20,000 family office contacts, 40,000+ registered investment advisor entities, and 743,000+ registered reps. Data is sourced from 10+ public & private sources. Equipped with 375+ search filters, FINTRX allows you to seamlessly track where family office and investment advisor capital is flowing, uncover allocation trends, break down investments by sector and size, understand future investment plans and more.


Copyright © 2026 FINTRX, Inc. All Rights Reserved. 18 Shipyard Drive Suite 2C Hingham, MA 02043 Data Privacy Policy
.png?width=367&height=109&name=ezgif.com-gif-maker%20(3).png)