
As the leading private wealth intelligence data solution, FINTRX is excited to release the Q1 2023 Family Office & RIA Data Report, which provides a comprehensive analysis of the latest developments in the industry as well as an overview of all FINTRX platform updates and additions made throughout the quarter. This report offers a deep dive into the private wealth landscape, including data-driven insights on the family office and registered investment advisor ecosystems.
Download the Report


Introduction
We are pleased to present our latest family office and registered investment advisor (RIA) Data Report, which features new and updated data collected and analyzed via FINTRX throughout Q1 2023. As the leading provider of private wealth intelligence, FINTRX is dedicated to providing the most comprehensive and accurate data available in the market.
This report provides a comprehensive overview of the family office and RIA ecosystem, including insights into key trends, investment preferences, geographic focus and more. Our data intelligence solution is designed to help financial institutions connect with potential investors, identify new opportunities and ultimately navigate the private wealth ecosystem with confidence.
Through a combination of proprietary research, data partnerships and advanced algorithms, FINTRX has built a rich and expansive database of family offices and RIAs worldwide. Our growing team of researchers work tirelessly to ensure that our data is accurate and up-to-date, providing clients with a reliable and trusted resource for their investment needs. We hope that this report will provide valuable insights and help our clients make informed decisions as they navigate the complex and ever-changing world of private wealth.
Note From Our VP of Research
Dear Reader,
I'm pleased to introduce our latest Family Office & Registered Investment Advisor (RIA) data report, featuring new and updated data collected and analyzed throughout Q1 2023. At FINTRX, we're committed to providing our clients with the most comprehensive and accurate data available, and this report is no exception.
Our team of expert researchers has been hard at work collecting and curating data on family offices and RIAs worldwide, and we're excited to share our insights with you. As always, our data is meticulously verified and updated on a daily basis, ensuring that our clients have access to the most reliable and up-to-date information possible.
This report provides a comprehensive overview of the family office and RIA ecosystem, including key trends, investment preferences and geographic focus, among others. We believe that this information will be valuable to financial institutions as they seek to connect with potential investors, identify new opportunities, and navigate the private wealth industry.
We're excited to continue providing our clients with the most advanced and comprehensive data intelligence solution available, and we look forward to your feedback on this latest report.
Sincerely,
Dennis Caulfield, Vice President of Research
Q1 '23 Family Office Data
Q1 Family Office Platform Updates & Additions
- New Family Offices Added: 150+
- New Family Office Contacts Added: 850+
- Newly Tracked Family Office Investments: 1,000+
- Total Family Office Additions: 1,000+
- Total Family Office Assets Added: $159.68 Billion
- Family Office Contacts Updated: 9,000+
- Total Family Office Firm Updates: 2,050+
- Total Family Office Updates (Firms & Contacts): 9,800+
Total Family Office Updates & Additions Made: 12,000+
Single-Family Offices vs Multi-Family Offices
Single-family offices (SFOs) are exclusive private wealth management firms designed to cater to the specific financial and investment needs of a single high-net-worth family or individual. These bespoke services are tailored to meet unique requirements and expectations, ensuring a highly personalized experience.
In contrast, multi-family offices (MFOs) extend comparable services to multiple affluent families or individuals. By leveraging shared resources and expertise among clients, MFOs have the ability to streamline costs, improve services and offer a more standardized approach to wealth management.
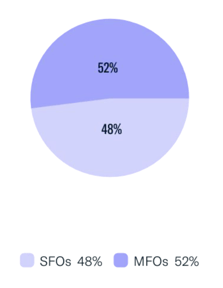
During the first quarter, FINTRX added 150 new family office entities to our private wealth database. Of these newly added firms, 52% are multi-family offices and 48% are single-family offices.
Asset Class Interest
Family offices typically have a wide investment appetite that spans numerous asset classes. Alternative asset classes offer an appealing option for private wealth individuals as they enable them to preserve their wealth and attain asset growth simultaneously.
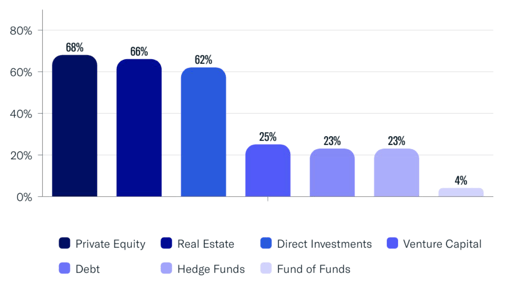
Based on the data provided by FINTRX, family offices are continuing to show a strong interest in alternative investments, with private equity being the most popular asset class. Real estate and direct investments are also among the top asset classes favored.
Assets Under Management (AUM)
Assets Under Management (AUM) is a term used to describe the total value of assets managed by family offices on behalf of their clients. This can include a range of assets, such as stocks, bonds, real estate, private equity, hedge funds, commodities, and other alternative investments. The size of AUM can vary significantly among family offices, based on the wealth and size of the families they serve.
The presented data shows the AUM ranges of recently added family offices during Q1. The majority of family offices, making up 28% of the sample size, have assets ranging between $100M-$400M. Following this, family offices with AUM between $400M-$1B represent 20% of the sample.
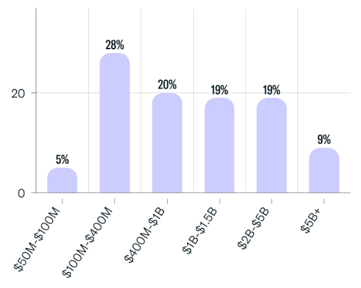
- Family Office Assets Added to FINTRX in Q1: $159.68 Billion
Single-Family Office Origin of Wealth Analysis
Based on our single-family office (SFO) origin of wealth analysis for Q1, we found that the majority of SFOs have accumulated their wealth through financial services. Real estate, private investors, retail and technology were also significant sources of wealth for SFOs throughout the quarter.
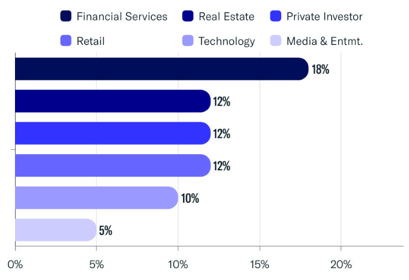
We also observed a growing trend of second-generation family members taking over family businesses and continuing the legacy of their parents. Our analysis suggests that SFOs continue to diversify their sources of wealth and prioritize long-term growth and sustainability. It's important to note that family office wealth can come from multiple sources.
Geographic Breakdown
This breakdown pertains to the geographical distribution of newly added family offices in our dataset during the quarter. The consistent growth of our family office dataset in Q1 paralleled the global increase in family offices.
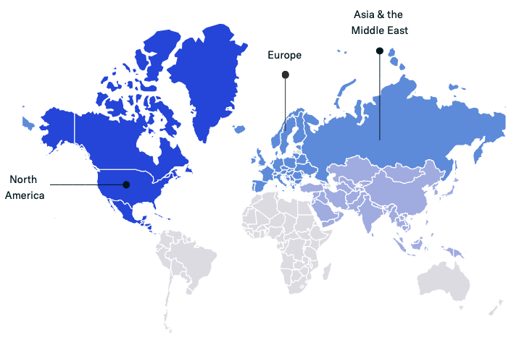
The geographical distribution of family offices has seen continued concentration in North America and Europe, together accounting for over 75% of the global total.
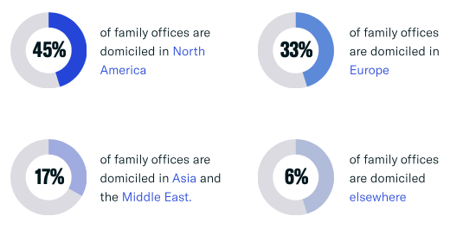
Meanwhile, the Asia-Pacific region has experienced a surge in growth, solidifying its position as the third-largest market for family offices, driven primarily by the expanding wealth in countries like China, India and Singapore.
Family Office Direct Transactions by Sector
Family offices have continued to increase their direct investment activity across various sectors throughout the quarter. With access to more capital than ever before, family offices are taking a more hands-on approach to investing, often seeking out opportunities that align with their interests and values. This trend is expected to continue throughout the year as family offices look for ways to diversify their portfolios and generate returns in a challenging market environment.
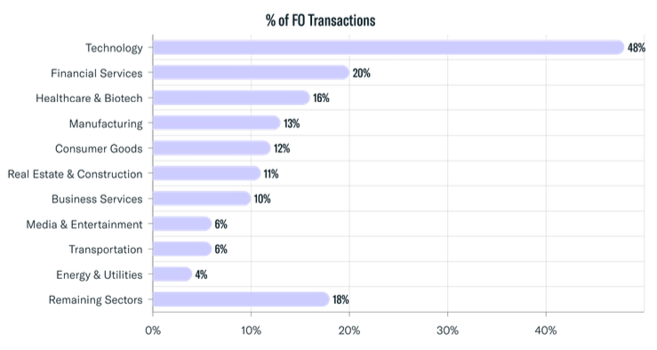
Technology maintained its position as the preferred industry for family office investments, accounting for 48% of family office investment activity in Q1. This translated to 480+ transactions made in private tech companies during the quarter. Apart from technology, family offices also expressed interest in sectors such as financial services, healthcare and biotech, manufacturing, consumer goods, real estate and construction and business services, among others.
Newly Tracked Family Office Investments in Q1: 1,000+
Q1 '23 Registered Investment Advisor (RIA) Data
Firm Type Breakdown
During Q1, the FINTRX data and research team added over 32,300+ registered firms to our RIA Dataset.
Total Registered Firms: 32,300+
Account Breakdown
Here we provide an account breakdown of all registered entities throughout the quarter.
Total Accounts: 63.7M+
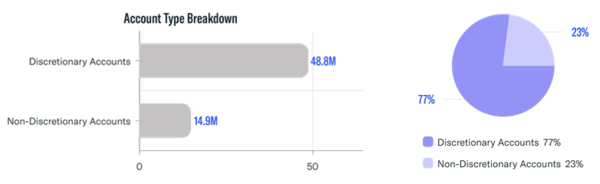
- - Total Discretionary Accounts: 48.8M (77%)
- - Total Non-Discretionary Accounts: 14.9M (23%)
Assets Under Management (AUM)
91% of AUM was discretionary throughout the quarter, compared to 9% of non-discretionary assets.
.png?width=599&height=218&name=RIA%20Assets%20Under%20Management%20(AUM).png)
Total Assets Under Management: $128.25T+ ($117.1T+ Discretionary; $11.1T+ Non Discretionary)
- - RIA Assets Under Management: $119.7T+
- - Dually Registered Assets Under Management: $8.5T+
Firm Size by Assets
Here we provide a breakdown of assets under management by company size for registered investment advisors added to FINTRX in Q1. A majority of firms added to the FINTRX RIA dataset in Q1 are considered 'Micro' groups, with assets up to $25M.
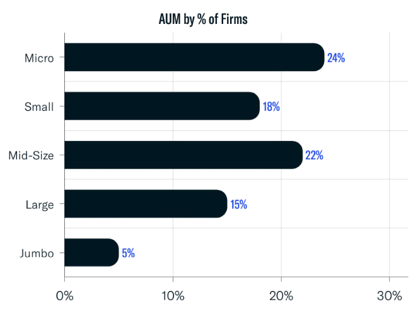
-----------------------------------------------
Micro: $1-$25M
Small: $25M - $100M
Mid-Size: $100M - $500M
Large: $500M - $5B
Jumbo: $5B+
-----------------------------------------------
Contact Breakdown
Total RIA Contacts: 743,000+
- - Female Reps: 26%
- - Male Reps: 74%
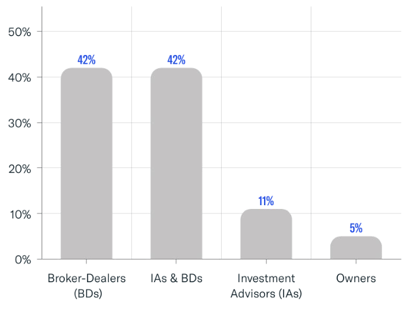
- - Broker-Dealers: 42%
- - Investment Advisors & Broker-Dealers: 42%
- - Investment Advisors: 11%
- - Owners: 5%
Alternatives Utilized
RIAs frequently utilize alternatives to diversify client portfolios, reduce risk and generate higher returns as opposed to traditional investments. Alternatives typically have lower correlations to the stock market and are therefore less volatile during periods of market movement.
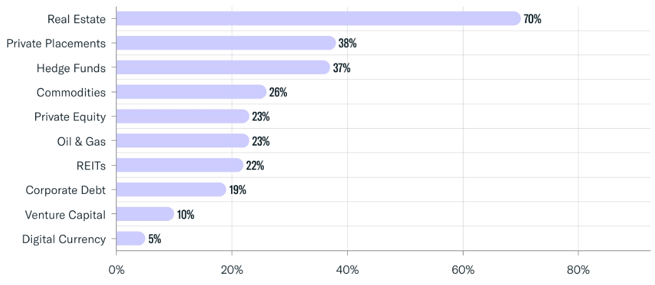
Around 70% of registered investment advisory firms that use alternative investments allocated a portion of their investment to real estate. Private placements, hedge funds, commodities, private equity, oil & gas and REITs were among other options utilized during the quarter.
Geographic Breakdown
The distribution of RIAs varies depending on the state or region of operation, with several states boasting a well-established RIA infrastructure, especially in major cities. The FINTRX RIA dataset reveals that California and New York hold the highest number of registered firms with a substantial concentration of such entities, both in terms of firm count and assets under management. 96% of RIAs are headquartered in offices throughout the US.
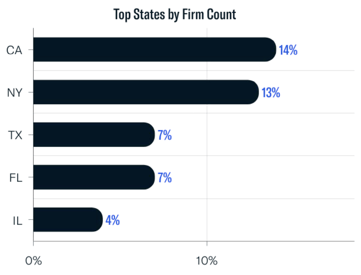
25% of the assets managed by investment advisor firms are located in New York. Massachusetts and California followed at 16% and 14%, respectively.
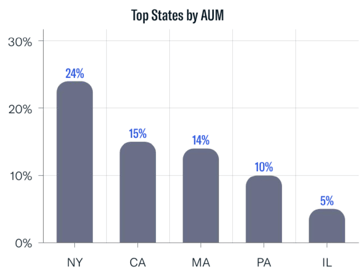
The United States accounts for about $113.3T in RIA assets under management throughout the quarter.
Fee Structures
The fee structure of registered investment advisors varies widely depending on the services they provide. RIAs typically charge fees based on a percentage of AUM, via fixed fees or hourly charges. Percentage-based fees typically range from 0.25% to 2.00% of AUM, depending on the size of the account while flat fees are typically charged for specific services or a combination of fees. Hourly rates vary based on the advisor's experience and the complexity of the services provided.
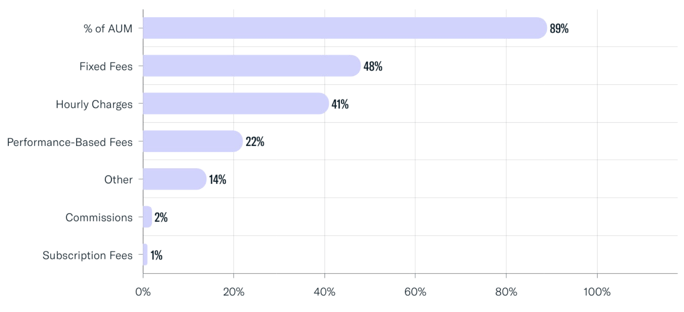
During the quarter, most RIAs utilized a fee structure based on a percentage of the assets under their management. However, there were some who utilized different fee structures such as fixed fees, hourly charges, and performance-based fees to charge their clients.
Entity Classifications
FINTRX uses proprietary algorithms to classify RIA and Broker Dealer firms based on their business activities. Individual firms may have any number of classifications assigned to them, and users can filter RIAs by their designated classification(s). This allows for efficient market research and targeting of specific types of RIAs. Classifications include Hedge Funds, Independent Wealth Advisors, Investment Banks, Liquidity Funds and Multifaceted Fund Managers, among others.
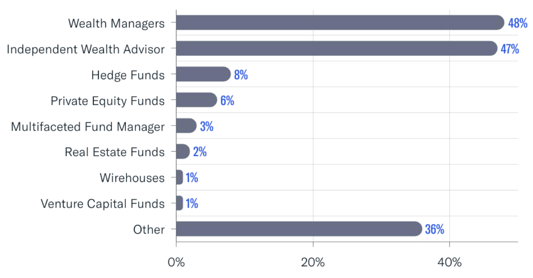
The majority of RIAs added to the FINTRX dataset in Q1 categorized themselves as either wealth managers or independent wealth advisors.
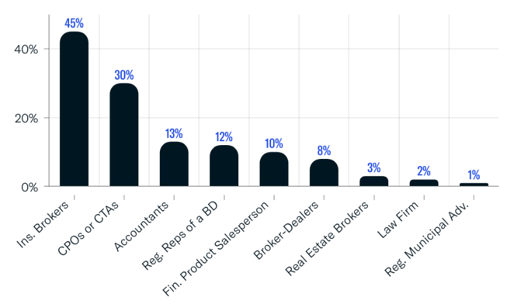
Business Activities
Throughout the first quarter of the year, insurance brokers and CPOs or CTAs were the most common types of business activities, accounting for 45% and 30% of the total, respectively.
Services Provided
RIAs provide a variety of services, ranging from portfolio management to financial planning to tax management. 76% of all registered firms provided portfolio management for individuals and small businesses and 55% of registered firms offered financial planning services.
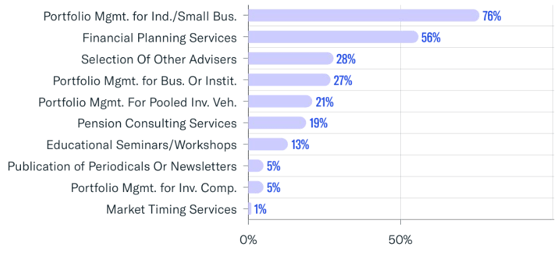
Other common services provided include the selection of other advisors, portfolio management for businesses or institutions, portfolio management for pooled investment vehicles and pension consulting services, among others.
Managed Accounts
Managed accounts allow for customization and personalization of investment strategies, as well as transparency and control to investors.
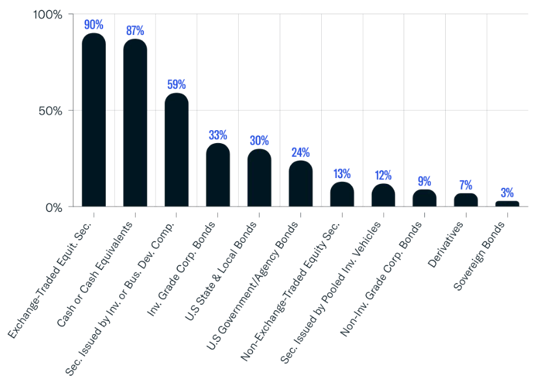
90% of companies owned exchange-traded stocks while 87% maintained cash or cash equivalents. Others utilized throughout the quarter include securities issued by investment or business development companies, investment grade corporate bonds and U.S State & Local Bonds, among numerous others.
Private Wealth Market Intelligence
In order to assist asset-raising professionals in locating, accessing and mapping the global private wealth ecosystem, FINTRX, a unified family office and registered investment advisor (RIA) data & research platform, offers comprehensive data intelligence on 850,000+ family office & investment advisor records.
Access AUM, source of wealth, investment criteria, prior investments, advisor growth signals, sectors and industries of interest and much more. FINTRX empowers you to keep your finger on the pulse of the rapidly changing and rather opaque private wealth ecosystem.
For further insight on how FINTRX can streamline your capital-raising efforts, request a demo below.


Copyright © 2026 FINTRX, Inc. All Rights Reserved. 18 Shipyard Drive Suite 2C Hingham, MA 02043 Data Privacy Policy
.png?width=367&height=109&name=ezgif.com-gif-maker%20(3).png)