
In an effort to shine a light on the private wealth ecosystem, FINTRX Family Office & RIA Database provider has compiled the Family Office & RIA Monthly Data Report to provide a high-level synopsis of the investment advisory landscape for April 2023. This report offers an inside look at all FINTRX platform updates and additions made throughout the month with metrics such as assets under management (AUM), alternatives utilized, fee structures, geographic breakdowns, separately managed accounts, family office direct transactions, RIA services provided and much more.
April 23' FINTRX Family Office & RIA Data Report
Download the Report


Family Office Platform Additions
Throughout April, the FINTRX Data & Research team added 46 new family offices, over 340 family office contacts and 220+ newly tracked investments to our Family Office Dataset.
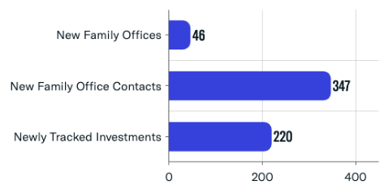
- - New Family Offices: 46
- - New Family Office Contacts: 347
- - Newly Tracked Family Office Investments: 220
Updated Family Office Entities
In addition to platform additions, the FINTRX Data & Research team made 5,100+ family office updates including 700+ family office firm updates and over 4,400+ family office contact updates.
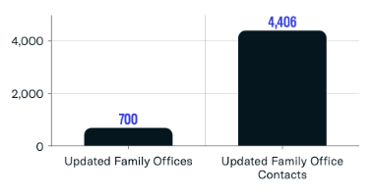
- - Updated Family Offices: 700
- - Updated Family Office Contacts: 4,406
Asset Class Interest Breakdown
Family offices are often interested in a wide range of asset classes to diversify their investments and achieve their financial goals. These asset classes often include alternative investments such as private equity, hedge funds and venture capital, among others. Throughout April, our family office dataset saw a majority of new family offices allocating to private equity, real estate and via direct investments into private companies.
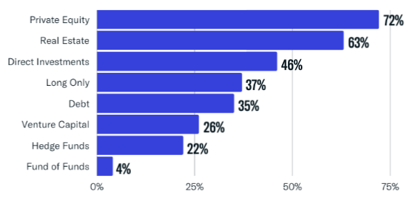
- - Private Equity: 72%
- - Real Estate: 63%
- - Direct Investments: 46%
- - Long Only: 37%
- - Debt: 35%
- - Venture Capital: 26%
- - Hedge Funds: 22%
- - Fund of Funds: 4%
Single-Family Offices vs. Multi-Family Offices
Throughout April, 76% of newly added firms are multi-family offices while 24% are single-family offices.
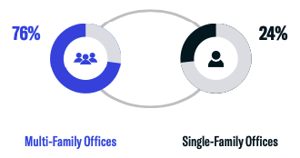
- - New Multi-Family Offices: 76%
- - New Single-Family Offices: 24%
Assets Under Management (AUM) Breakdown
Nearly 70% of family offices added to FINTRX in April (that disclosed their AUM) have assets within the ranges of $400M-$1B, $1B-$1.5B and $2B-$5B.
%20Breakdown_April%202023.png?width=354&height=133&name=Assets%20Under%20Management%20(AUM)%20Breakdown_April%202023.png)
- $100M-$400M: 15%
- $400M-$1B: 23%
- $1B-$1.5B: 23%
- $1.5B-$2B: 8%
- $2B-$5B: 23%
- $5B+: 8%
Family Office Geographical Breakdown
The chart below displays a geographical breakdown of all new family offices added to the FINTRX family office dataset throughout April. A majority of newly added firms are headquartered in North America, accounting for 43%, while Europe is home to 33% of the new additions.
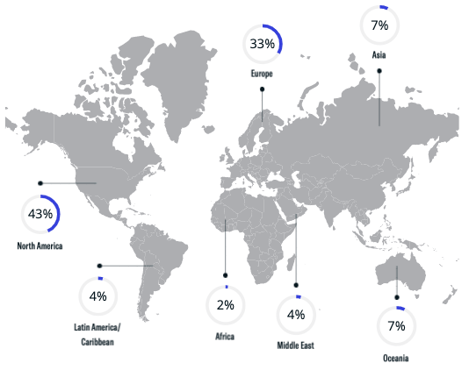
- - North America: 43%
- - Europe: 33%
- - Asia: 7%
- - Oceania: 7%
- - Middle East: 4%
- - Latin America/Caribbean: 4%
- - Africa: 2%
Newly Tracked Family Office Investments
Top 10 Sectors of Interest
Family office direct transactions refer to investments made directly by a family office into a specific company, project or asset, rather than through a fund or other intermediaries. This approach allows family offices to have more control and visibility over their investments, and potentially higher returns. A significant portion of newly added firms (45%) demonstrated a preference for direct investments in the technology sector with over 100 investments made. Other sectors attracting attention included financial services, healthcare & biotechnology and consumer goods.
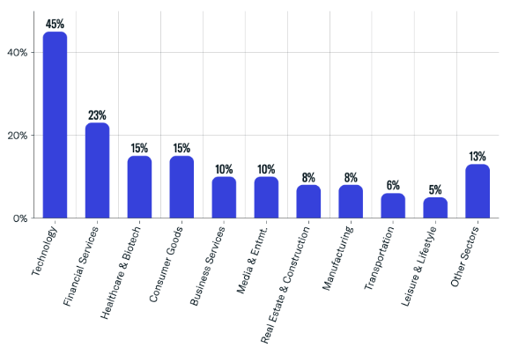
- - Technology: 45%
- - Financial Services: 23%
- - Healthcare & Biotech: 15%
- - Consumer Goods: 15%
- - Business Services: 10%
- - Media & Entertainment: 10%
- - Real Estate & Construction: 8%
- - Manufacturing: 8%
- - Transportation: 6%
- - Leisure & Lifestyle: 5%
- - Other Sectors: 13%
April 23' Registered Investment Advisor (RIA) Data
RIA Data Highlights: April Platform Additions
- - Total Registered Entities (including Dually Registered): 168
- - Total Registered Contacts: 5,790+
- - Total Accounts: 190+
- - Firms Using Alternatives: 125 or 74%
- - Assets Under Management: $14.5B+
Accounts Breakdown
- - Total Accounts: 190+
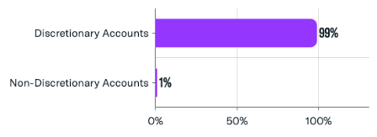
The FINTRX RIA dataset saw a significant addition of discretionary accounts in April, which made up 99% of new accounts added.
Contact Breakdown by Rep Type
Of the 5,790 registered reps added to the FINTRX RIA dataset in April, a majority (65%) are registered as broker-dealers. Smaller segments included those registered as investment advisors at 25% and a combined 10% as owner-only contacts and dually registered reps.
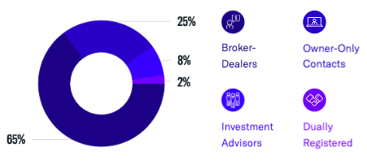
- - Broker-Dealers: 3,750+
- - Owner-Only Contacts: 1,460+
- - Investment Advisors: 480+
- - Dually Registered: 80+
RIA Client Base Breakdown
The newly added RIA firms added to the FINTRX dataset in April reveal that 67% of their RIA clientele are institutional clients, while individual and family clients account for 33%.
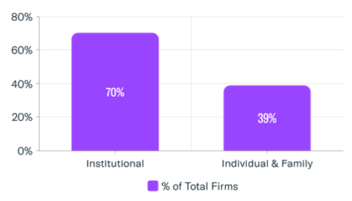
- - Institutional Clients: 67%
- - Individual & Family: 33%
Firm Size by Assets Under Management (AUM)
The size of an RIA firm can be measured by its assets under management (AUM), or the total value of assets the firm oversees on behalf of its clients. A majority (42%) of newly added RIA firms are considered 'Micro' groups, with assets between $1M-$25M. Groups with AUM between $100M-$500M followed at 25%.
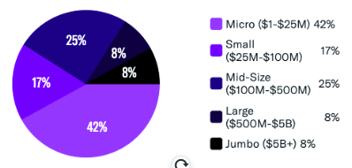
- - Micro ($1-$25M): 42%
- - Small ($25M-$100M): 17%
- - Mid-Size ($100M-$500M): 25%
- - Large ($500M-$5B): 8%
- - Jumbo ($5B+): 8%
Rep Gender Breakdown
The gender breakdown of RIA representatives refers to the proportion of male and female advisors working in the RIA industry. 75% of RIA firms added to the FINTRX RIA Dataset in April are male reps while 25% are female reps.
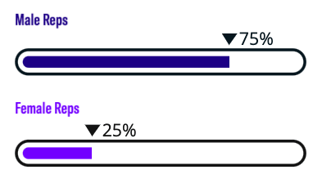
- - Male Reps: 75%
- - Female Reps: 25%
RIA Services Provided
Of the new RIA firms incorporated into the FINTRX platform in April, 79% offer portfolio management for individuals and small businesses, while 61% also provide financial planning services. Additional investment advisory services provided include portfolio management for businesses and institutions, selection of other advisors, pension consulting services and educational seminars, among several others. It's important to note, RIA firms can and often have more than one service offered.
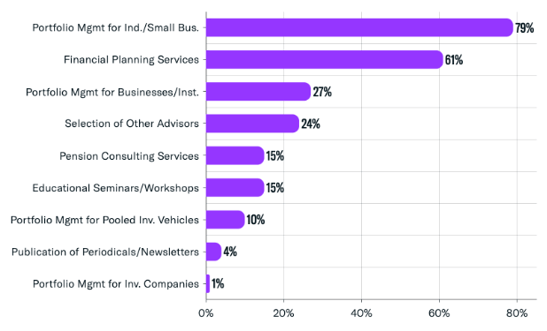
Top RIA Services Provided:
- 1. Portfolio Management for Individuals/Small Businesses: 79%
- 2. Financial Planning Services: 61%
- 3. Portfolio Management for Businesses/Institutions: 27%
- 4. Selection of other Advisors: 24%
- 5. Pension Consulting Services: 15%
- 6. Educational Seminars/Workshops: 15%
- 7. Portfolio Management for Pooled Investment Vehicles: 10%
- 8. Publication of Periodicals/Newsletters: 4%
- 9. Portfolio Management for Investment Companies: 1%
Alternative Investments Utilized
Firm Level
The utilization of alternative investments by RIA firms varies, with some firms having a significant portion of their assets invested in alternatives, while others may have a more limited exposure. 72% of the recently added RIA firms demonstrated some allocation to real estate within their portfolios. A smaller fraction displayed interest in hedge funds and private placements, among a variety of other investment options.
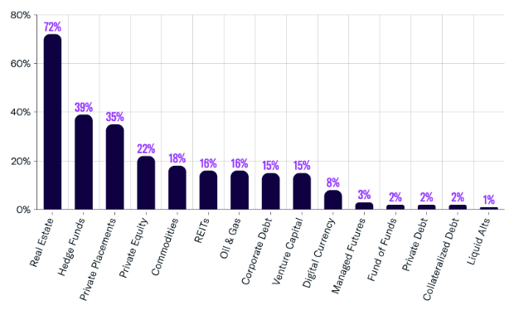
- - Real Estate: 72%
- - Hedge Funds: 39%
- - Private Placements: 35%
- - Private Equity: 22%
- - Commodities: 18%
- - REITs: 16%
- - Oil & Gas: 16%
- - Corporate Debt: 15%
- - Venture Capital: 15%
- - Digital Currency: 8%
- - Managed Futures: 3%
- - Fund of Funds: 2%
- - Private Debt: 2%
- - Collateralized Debt: 2%
- - Liquid Assets: 1%
FINTRX is a unified data & research platform providing comprehensive data intelligence on 850,000+ family office & investment advisor records, each designed to help asset-raising professionals identify, access & map the global private wealth ecosystem. Find relevant decision-makers in a snap with powerful search filters and queries. Uncover the data you need, when you need it and filter through areas of investment interest, AUM, asset flows, intent signals, potential associates and much more...
For additional details and a live walkthrough, request a demo below.


Copyright © 2026 FINTRX, Inc. All Rights Reserved. 18 Shipyard Drive Suite 2C Hingham, MA 02043 Data Privacy Policy
.png?width=367&height=109&name=ezgif.com-gif-maker%20(3).png)