
To shine a light on the Registered Investment Advisor (RIA) landscape, FINTRX - family office and RIA database provider - has compiled the RIA Monthly Data Report to provide a high-level synopsis of the RIAs landscape for January 2022. Explore metrics such as total registered firms, alternatives used, assets under management, representative breakdown, geographical breakdown, services provided, fee structures utilized, and more. Download the 9-page report below...
Introduction
Hello and welcome to the RIA Monthly Data Report for January 2022. All data throughout this report was compiled by utilizing the FINTRX Family Office & Registered Investment Advisor Data Platform.
An RIA is defined as any individual or firm registered with the Securities and Exchange Commission (SEC) or State Securities Authorities that advises and offers analyses on investments based on a client's individual needs. RIAs act fiduciarily, always acting in the best interest of their clients.
RIAs advise on a range of financial subjects, from retirement planning to insurance and estate planning. The total RIA market is diverse and includes any firm registered as a registered investment advisory firm. It comprises banks, broker/dealers, financial planners, hedge funds, family offices, asset managers, wealth managers, and more. If firms want to give advice as fiduciaries for a fee, they must register as an RIA to do so.
The sample size used throughout this report does not include firms registered solely as broker-dealers.
Firm Breakdown
- - Total Registered Firms: 31,793
- - Total Dually Registered Firms: 470
- - 98% of firms are registered solely as an investment advisor
- - 2% of all registered firms are registered as both an RIA and a Broker-Dealer
Alternatives Used
- - Real Estate (71%)
- - Private Placements (38%)
- - Hedge Funds (37%)
- - Commodoties (25%)
- - Private Equity (23%)
Accounts Breakdown
- - Total Accounts: 63,018,632
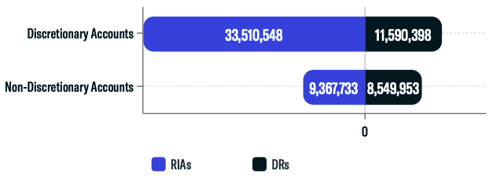
Of the total accounts, 72% are discretionary, while 28% of accounts are non-discretionary.
AUM Breakdown
- - Total Assets Under Management (AUM): $113,457,433,147,650.00
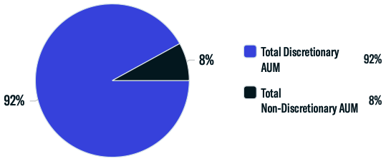
- - Total Discretionary AUM: 92%
- - Total Non-Discretionary AUM: 8%
Representative Breakdown
by Rep Type
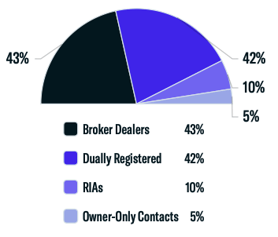
- - Broker-Dealers: 43%
- - Dually Registered: 42%
- - RIAs: 10%
- - Owner-Only Contacts: 5%
Rep Gender Breakdown
Male vs Female Reps
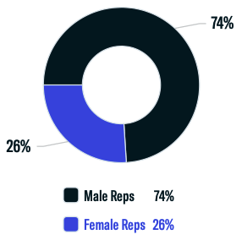
- - Male Reps: 89%
- - Female Reps: 87%
Total Firms Using Separately Managed Accounts (SMAs)
- - Total Firms Using SMAs: 22,475 (or 71% of all registered firms)
Here, we demonstrate the types of investments utilized throughout separately managed accounts. For instance, 89% of groups hold Exchange-Traded Equities within their separately managed accounts. Cash or cash equivalents followed, at 87%.
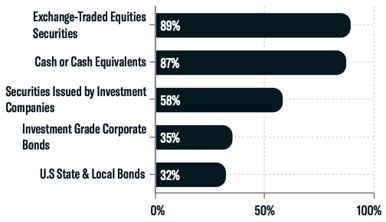
- - Exchange-Traded Equities Securities: 89%
- - Cash or Cash Equivalents: 87%
- - Securities Issued by Investment Companies: 58%
- - Investment Grade Corporate Bonds: 35%
- - US State & Local Bonds: 32%
Geographic Breakdown
Top States by Firm Count:
71% of all RIAs are headquartered in offices throughout the United States. Here, we display the top five US states with the most number of RIA firms. In January, 15% of RIA firms are domiciled in California while 13% are based in New York.

- - California: 15%
- - New York: 13%
- - Texas: 7%
- - Florida: 6%
- - Illinois: 4%
Top States by AUM:

- - NY: $24,189,427,976,082
- - CA: $17,155,489,112,722
- - MA: $13,223,114,458,129
- - PA: $10,130,265,049,727
- - IL: $5,316,147,379,527
Services Provided
Below we provide the percentage of RIAs that offer the following services. Of all the services provided, portfolio management for individuals and small businesses was the most popular, at 75%. Financial planning services followed at 54%.
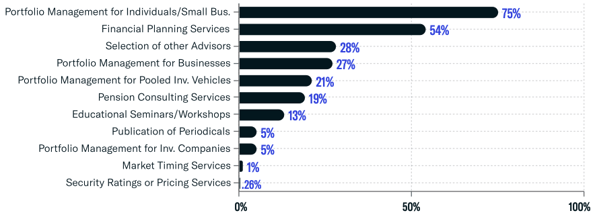
- 1. Portfolio Management for Individuals & Small Businesses: 75%
- 2. Financial Planning Services: 54%
- 3. Selection of other Advisors: 28%
- 4. Portfolio Management for Businesses: 27%
- 5. Portfolio Management for Pooled Investment Vehicles: 21%
Fee Structures Utilized
89% of RIAs compensate through a percentage of assets under management. Others use fixed fees, hourly charges, and performance-based fees as a means to charge clients.
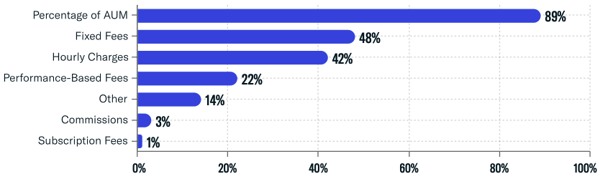
Top 5 Fee Structures Utilized:
- 1. Percentage of AUM: 74%
- 2. Fixed Fees: 26%
- 3. Hourly Charges: 74%
- 4. Performance-Based Fees: 26%
- 5. Other: 74%
Download the Report

FINTRX provides comprehensive data intelligence on 750,000+ family office & investment advisor records, each designed to help you identify, access, and map the private wealth ecosystem. Explore in-depth dossiers on each family office & investment advisor. Access AUM, source of wealth, investment criteria, previous investment history, sectors & industries of interest, advisor growth signals, amongst other key data points.
Additionally, FINTRX provides insight and expansive contact information on key decision-makers, featuring job titles, direct email addresses, phone numbers, common connections, alma maters, past employment history, brief bios & much more.
For additional details and a live walkthrough, request a demo below.


Copyright © 2026 FINTRX, Inc. All Rights Reserved. 18 Shipyard Drive Suite 2C Hingham, MA 02043 Data Privacy Policy
.png?width=367&height=109&name=ezgif.com-gif-maker%20(3).png)