
As the leading private wealth data intelligence solution, FINTRX is pleased to release the next iteration of our quarterly Private Wealth Data Report. This report serves as a high-level synopsis of the global investment advisor and family office landscapes and trends throughout Q3 2023 with data compiled using the FINTRX Family Office & RIA Data Platform. This report offers a deep dive into the private wealth landscape, including data-driven insights on the family office and registered investment advisor ecosystems as well as an overview of all FINTRX platform updates and additions made throughout the quarter.
Download the Report

Introduction
Welcome to the Q3 2023 FINTRX Private Wealth Data Report: a high-level synopsis of the global investment advisor and family office landscapes and trends throughout Q3 with data compiled using the FINTRX Family Office & RIA Data Platform.
As the preeminent source for private wealth industry intelligence, FINTRX is dedicated to providing the most comprehensive and accurate data possible. As registered investment advisors and family offices continue to gain traction despite turbulent markets, FINTRX empowers financial institutions to connect with potential investors, identify new opportunities and ultimately navigate the private wealth ecosystem with confidence.
All research and insights contained within this report are compiled from our extensive RIA and family office dataset - built through a combination of proprietary research, data partnerships and advanced algorithms. Our 75+ researchers work tirelessly to ensure that our data is accurate and up-to-date, providing clients with a reliable and trusted resource for their investment needs.
We hope this report will provide the valuable data and insights needed to help our clients make informed decisions as they navigate the complex and ever-changing world of private wealth.
Note From Our VP of Research
Dear Reader,
It gives me immense pleasure to introduce the latest Private Wealth Data Report for Q3 of 2023. This latest iteration of our quarterly series provides a comprehensive snapshot of family office and registered investment advisor data, meticulously collected over the recent months by the FINTRX Data and Research Team.
At FINTRX, we remain committed to arming asset-raising and financial professionals with the pinnacle of data intelligence surrounding the private wealth landscape.
I would like to extend my appreciation to our valued clients for continuing to trust our team to be the provider of your family office and investment advisor research and data. We value your partnership above all else.
If you have questions regarding the data or would like to discuss the report further, please do not hesitate to reach out to our team. Our goal, as always, is to support your success in navigating the rapidly evolving private wealth ecosystem.
Thank you for taking the time to read our report.
Warm Regards,
Dennis Caulfield, Vice President of Research
Family Office Data
Q3 Family Office Platform Updates & Additions
- New Family Offices Added: 130+
- New Family Office Contacts Added: 1,040+
- Tracked Family Office Investments Added: 880+
- Total Family Office Additions: 2,070+
- Total Family Office Assets Added: $188.6 Billion+
- Family Office Firm Updates: 1,130+
- Family Office Contact Updates: 8,310+
Total Family Office Updates & Additions Made in Q3: 11,500+
Family Office Breakdown
Single Family Offices vs Multi-Family Offices
Single family offices (SFOs) are private wealth management firms created by high-net-worth individuals and families that are designed to provide completely customized and unique financial and investment services for that family. Multi-family offices (MFOs) provide similar services to a group of clients, using shared resources to streamline costs and provide a more standardized approach to wealth management.
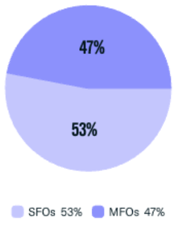
137 family offices were added to FINTRX in Q3. The chart above shows the percentage breakdown of SFOs vs MFOs, with the majority of firms (53%) being single family offices.
Assets Under Management (AUM)
Assets under management refers to the total value of assets that a family office manages on behalf of their clients, which can include a wide variety of assets such as stocks, real estate, private equity, hedge funds and other alternatives. AUM can vary greatly amongst family offices, depending on the number of families they serve and their cumulative net worth.
The graph below displays the AUM ranges (in USD) for family offices added in Q3. The majority of firms added manage between $100M and $1B in assets, accounting for 58% of firms. Family offices with over $2B accounted for 29%.
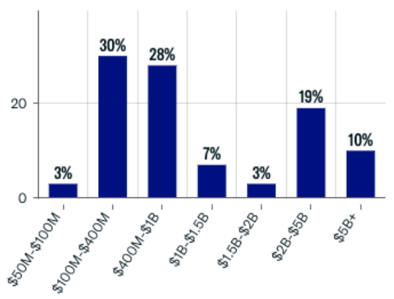
Total Family Office Assets Added to FINTRX in Q3: $188.65 Billion
Asset Class Interest
Family offices generally demonstrate a significant interest in investing across various asset classes. Alternative assets provide an efficient means of portfolio diversification and serve as a valuable counterbalance to traditional investments, offering a measure of insulation from economic downturns.
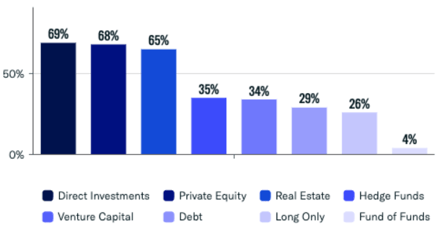
Family offices slightly shifted their focus away from real estate in Q3, focusing more heavily on direct investments into private companies. FINTRX data also shows an increased interest in hedge fund investing through 2023, up to 35% in Q3 from 23% in Q1.
Single Family Office Wealth Origin Analysis
Historically, there has been a strong correlation between the industry from which a family office's wealth originates and the industries of interest for potential investment activity. This phenomenon can be attributed to the individual or family's unique expertise with that particular industry and a desire for continued involvement in an industry that has driven their past success.
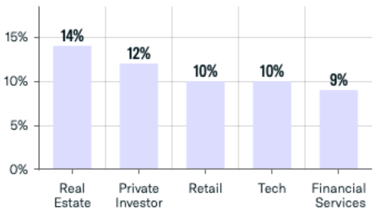
For single family offices added in Q3, the most common industries of wealth origin were real estate & private investing.
Geographic Breakdown
The map below represents the geographic distribution of the family offices that were added to the FINTRX platform for the quarter. The consistent growth of our Family Office dataset reflects the rise in family office numbers worldwide.
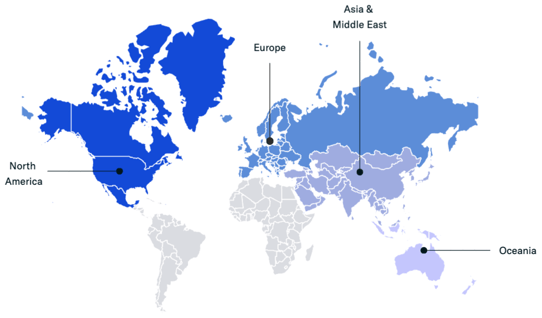
We continue to see significant concentration of family offices in North America and Europe, whose numbers account for 63% of the family offices added in Q3.
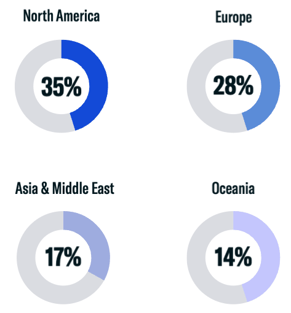
Meanwhile, Asia has continued to grow in the family office realm, as cities such as Dubai, Hong Kong, Tokyo, Singapore and Beijing fight to expand their coverage and solidify themselves as global family office hotspots. Additionally, Oceania has also seen a significant rise in family office numbers, with 14% of total added firms in Q3.
This surge in private wealth management for Asia and Oceania can be attributed to the burgeoning wealth and tax and economic incentives prevalent in many of these regions' most influential countries.
Family Office Direct Investments by Sector
We continue to see family offices harnessing direct investment opportunities, often motivated by a desire for more power over asset allocation decisions and a more hands-on approach with the business operations of the companies in which they invest. Direct investments can be both a challenging and rewarding method of portfolio diversification, and despite turbulent and uncertain markets in 2023, family offices continue to make such investments, leaning on innovation to drive success. The graph below depicts the top ten sectors in which family offices made direct investments throughout Q3.
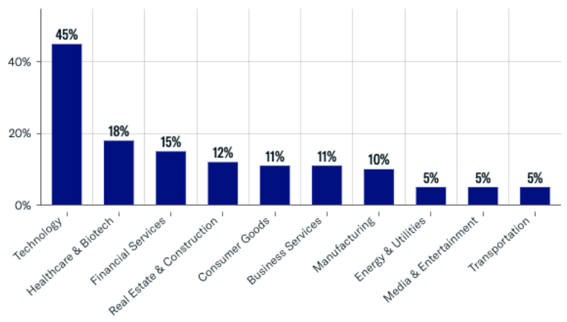
Technology remained the leading industry for direct family office investments, making up 45% of tracked transactions throughout the quarter. This translated to 400+ transactions made into private technology companies. As technological innovation continues to drive the global economy, we will continue to see substantial private capital flow into emerging tech companies.
Q3 also saw an increased interest in healthcare & biotech as well as real estate & construction, as investors moved away from manufacturing. Despite shifts in investment trends quarter over quarter, the top ten sectors remain the same over the long term.
New Family Office Direct Investments Tracked in Q3: 889
Registered Investment Advisor (RIA) Data
RIA Overview
A registered investment advisor (RIA) is an individual or firm registered with the SEC or State Securities Authorities that advises or manages investments on behalf of individuals or institutions, following a fiduciary standard to act in the clients' best interests.
The term 'RIA' can refer to many different types of entities, from banks to hedge funds to traditional wealth managers. For the purpose of this report, we not include data on firms exclusively registered as broker dealers.
As global wealth rises and the U.S. economy experiences consistent turbulence post-pandemic, the demand for RIA services has grown. More and more, we see individuals and institutions turning to these entities to assist in managing capital and to provide advice for those who feel unequipped to successfully navigate today's complex investment terrain.
FINTRX RIA Data Coverage
The FINTRX registered investment advisor dataset covers nearly 40,000 registered entities, 32,000+ RIA firms and 750,000+ registered reps with data on investment trends, AUM & accounts, private funds and more.
Total RIA Firms in Q3 (including firms dually registered as RIA & broker dealer): 32,590+
Assets Under Management (AUM)
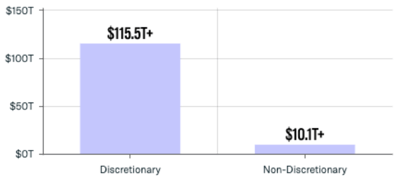
The chart below depicts the breakdown of managed assets on a discretionary vs. non-discretionary basis. In Q3, 91% of assets managed were discretionary, allowing advisors to make investment and allocation decisions on behalf of their clients. Only 9% of client assets were managed on a non-discretionary basis.
-
Total AUM (including firms dually registered as RIA & broker dealer): $125 Trillion+
-
RIA Total AUM: $118 Trillion+
Firm Size by Assets
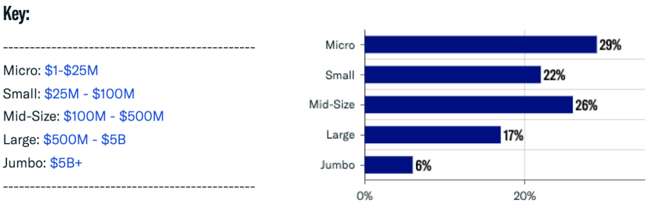
Here we provide a breakdown of the size of RIA firms based on their total assets under management. The large majority of registered entities managed less than $500 million in assets in Q3, with 51% of firms managing less than $100 million. 'Jumbo' firms with over $5 billion in AUM accounted for a mere 6% of the RIA ecosystem.
Account Breakdown
Here we provide an analysis of discretionary vs. non-discretionary accounts for RIAs in Q3 with both number and percentage breakdowns.
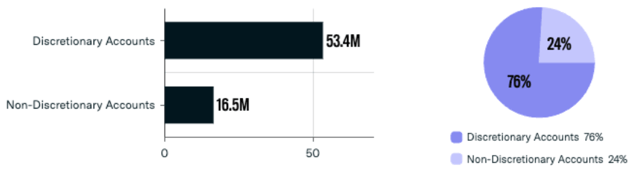
Total Accounts: 69.9 Million+
Alternatives Utilized
Incorporating alternatives into client portfolios is a common strategy to diversify portfolios, mitigate risk, and pursue potentially higher returns compared to traditional investments. These alternative assets are typically less correlated with the stock market, which helps reduce vulnerability to market volatility and fluctuations. The graph below shows a breakdown of the top ten most common alternative investments utilized by RIAs in Q3, with the majority of entities (71%) showing activity in real estate.
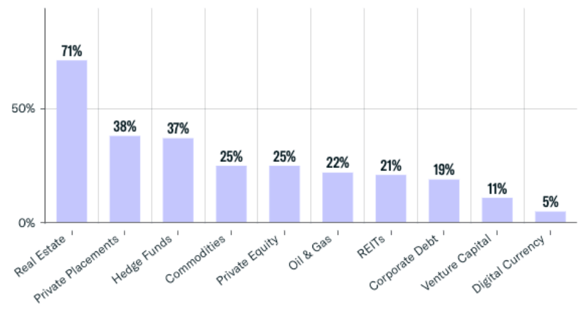
Firms Active in Alternatives: 25,400+
Geographic Breakdown
It is common for the HQ offices of RIAs to be concentrated in and around major cities across the United States. Unsurprisingly, New York and California are the largest hubs for RIAs, as they house the two largest, wealthiest metropolitan areas in the country.
Below is an analysis of registered investment advisors by HQ location, including the top states by both total managed assets and firm count.
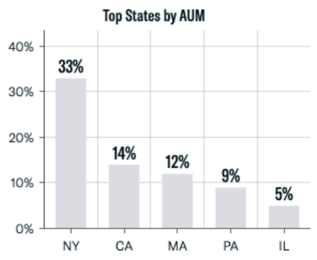
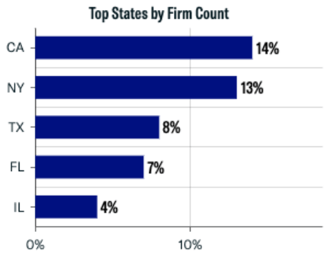
The United States accounts for about 96% of registered investment advisor firms and 90% of total global RIA assets, or roughly $114 trillion.
Firm Classifications
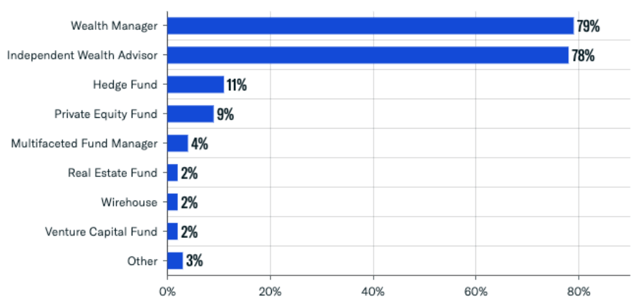
FINTRX uses proprietary algorithms to classify registered firms based on their business activities. Individual entities may have several classifications if they offer multiple different types of services to their clients. Our advanced platform offers users the capability to filter RIAs based on these classifications, enabling more efficient market research and prospecting.
Here we provide a breakdown of the most common classifications of RIAs throughout Q3, with the majority classified as wealth managers and/or independent wealth advisors.
Fee Structures
RIAs offer a variety of different fee frameworks based on the services they offer or their target client type. The most common fee structures are some combination of percentage of AUM, fixed rates, or hourly charges. Fees based on AUM usually fall between 0.25% and 2.00%, contingent on the account size.
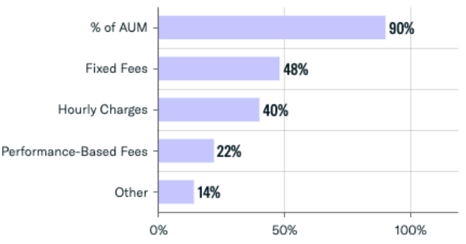
The predominant fee structure among firms in Q3 continued to be a percentage of managed assets (90%), followed by fixed fees (48%), hourly rates (40%) and performance-based fees (22%). Other fee types may include commissions or subscription-type fees.
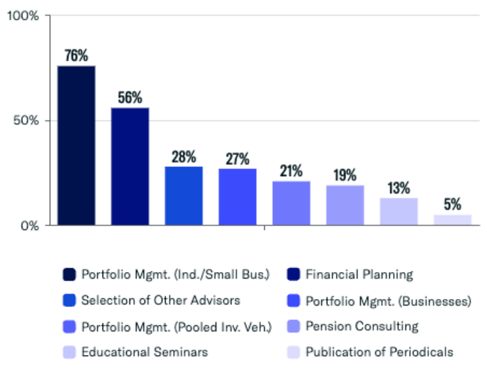
Services Provided
RIAs provide their clients a variety of services, from portfolio management to financial planning to tax management. The graph below depicts the most common services offered by RIAs in Q3. The most common service offered was portfolio management for individuals and small businesses at 76%, followed by financial planning at 56% and selection of other advisors at 28%.
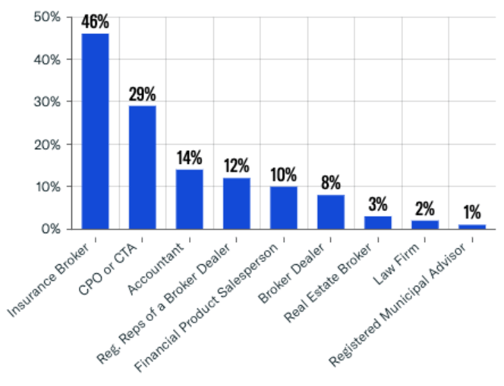
Business Activities
RIAs often provide a variety of business services beyond wealth management or asset allocation in order to offer their clients a comprehensive suite of financial services. In Q3, insurance brokering was the most common additional activity, representing 46% of these additional operations, and commodity pool operations (CPO) or commodity trading advising (CTA) accounted for 29% of such activities.
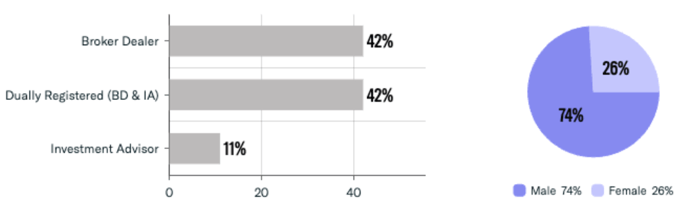
Contact & Rep Breakdown
FINTRX provides data on over 750,000 contacts and registered reps active in the RIA and broker dealer industry. Here we provide an analysis of the contacts covered by our dataset in Q3, with a breakdown of reps by registration type and by gender. 84% of reps are registered as broker dealers or dually registered as both broker dealer & investment advisor.
Total Contacts: 752,000+
Separately Managed Account (SMA) Asset Allocation
Separately managed account (SMA) asset allocation refers to the breakdown of assets held of behalf of clients excluding other investment companies, business development companies and pooled investment vehicles. These SMAs are made up of various asset types, most commonly exchange-traded equities, such as stocks and ETFs, and cash or cash equivalents.
The use of SMAs offers more flexibility and customization of investment strategies, and as a result, may include higher management fees.
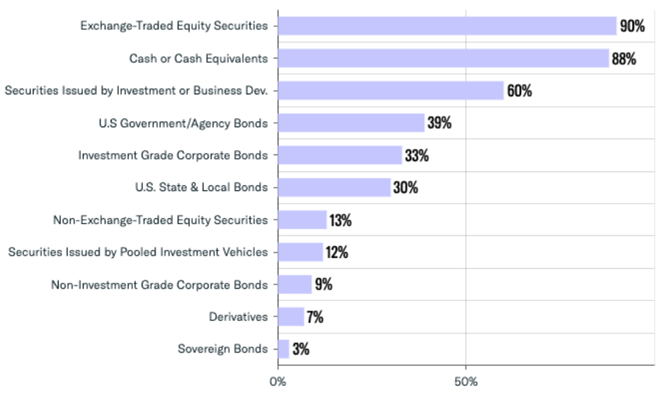
Through Q3, 90% of RIAs utilized exchange-traded securities and 87% maintained cash or cash equivalents. The other most commonly utilized SMA assets throughout the quarter included securities issued by investment or business development companies, investment grade corporate bonds and a significantly higher usage of U.S government agency bonds.
FINTRX Private Wealth Market Intelligence
FINTRX is a unified data and research platform providing comprehensive data intelligence on 850,000+ family office & investment advisor records, each designed to help asset-raising professionals identify, access and map the global private wealth ecosystem.
FINTRX data covers nearly 4,000 family offices, 20,000 family office contacts, 40,000+ investment advisor entities, and 752,000+ registered reps sourced from both public and private sources. Equipped with 375+ search filters, FINTRX allows you to seamlessly track the flow of private capital, uncover allocation trends, and break down investment data.
FINTRX provides in-depth dossiers on each family office and investment advisor, allowing asset-raising professionals to access AUM, source of wealth, investment criteria, past investments made, advisor growth signals, sectors & industries of interest and more.
Additionally, FINTRX offers expansive contact information on 850,000+ private wealth decision-makers, featuring job titles, direct email addresses, phone numbers, common connections, past employment & education history, and brief bios to empower you to book more meetings, increase efficiency and expand your global network.


Copyright © 2026 FINTRX, Inc. All Rights Reserved. 18 Shipyard Drive Suite 2C Hingham, MA 02043 Data Privacy Policy
.png?width=367&height=109&name=ezgif.com-gif-maker%20(3).png)