
START YOUR FREE TRIAL
GET STARTED
The Industry’s Most Trusted Private Wealth Data—Comprehensive, Accurate, and Current
Explore the leading platform used by asset managers to find and engage with RIAs, Broker-Dealers, Family Offices, Foundations & Endowments. Request your free trial of FINTRX now and see for yourself.
Blog & Resources
NEWS AND INSIGHTS FROM FINTRX
Monthly Family Office Data Report: November 2022
Hello
Each month, FINTRX - Family Office & Registered Investment Advisor Platform adds and updates hundreds of family offices, family office contacts, tracked investments and assets to our private wealth dataset. To showcase this model of growth, we have compiled a breakdown of all new and updated family office data from November 2022.
Family Office Platform Updates & Additions
- - New Family Offices: 60
- - New Family Office Contacts: 280+
- - Total Family Office Additions: 500+
- - Total Family Office Updates: 3,080+
- - Newly Tracked Family Office Investments: 160+
- - Total Family Office Platform Updates & Additions: 3,500+
- - New Family Office Assets Tracked: $191.63B+
Family Office Platform Additions
Throughout November, the FINTRX Data & Research team added 60 new family offices, 280+ family office contacts and 160+ newly tracked investments to our family office dataset.
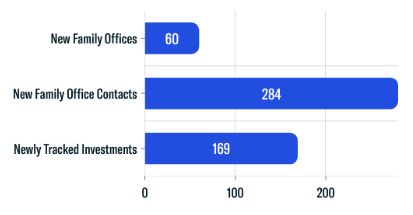
- - New Family Offices: 60
- - New Family Office Contacts: 284
- - Newly Tracked Family Office Investments: 169
Updated Family Office Entities
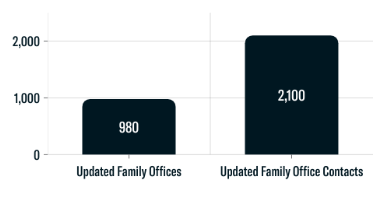
- - Updated Family Offices: 980
- - Updated Family Office Contacts: 2,100
Asset Class Interest Breakdown
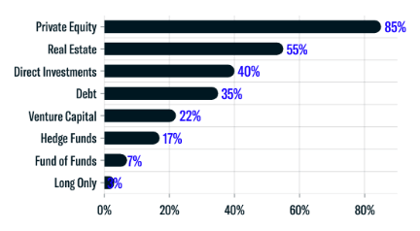
- - Private Equity: 85%
- - Real Estate: 55%
- - Direct Investments: 40%
- - Debt: 35%
- - Venture Capital: 22%
- - Hedge Funds: 17%
- - Fund of Funds: 7%
- - Long Only: 3%
Assets Under Management (AUM)
The following chart accounts for all family offices added to our dataset throughout November that disclosed their assets under management. A majority of firms have assets between $100M - $400M and $400 - $1B.
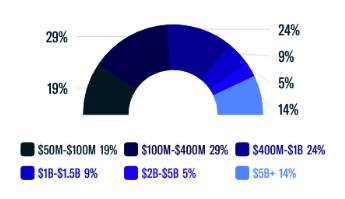
- - $50M-$100M: 19%
- - $100M-$400M: 29%
- - $400M-$1B: 24%
- - $1B-$1.5B: 9%
- - $2B-$5B: 5%
- - $5B+: 14%
Single-Family Offices vs. Multi-Family Offices
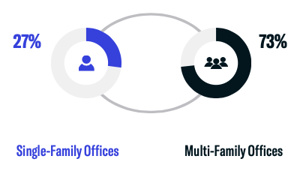
- - Single-Family Offices: 27%
- - Multi-Family Offices: 73%
Family Office Geographical Breakdown
Regions with New Family Office Activity
The chart below displays the geographical breakdown of all new family office entities added to our dataset in November. A majority of groups are domiciled in North America and Europe.
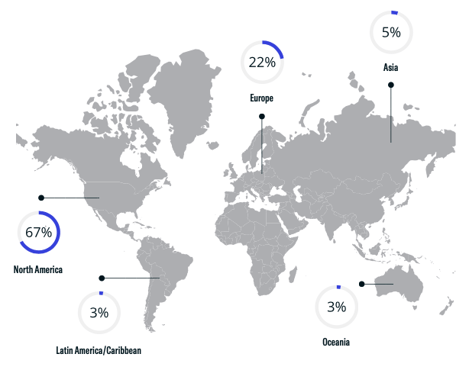
- - North America: 67%
- - Europe: 22%
- - Asia: 5%
- - Latin America/Caribbean: 3%
- - Oceania: 3%
Newly Tracked Family Office Investments
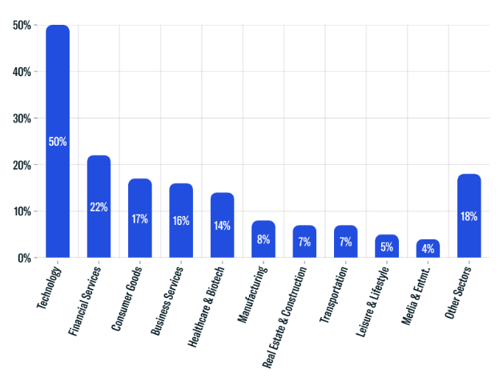
- - Technology: 50%
- - Financial Services: 22%
- - Consumer Goods: 17%
- - Business Services: 16%
- - Healthcare & Biotech: 14%
- - Manufacturing: 8%
- - Real Estate & Construction: 7%
- - Transportation: 7%
- - Leisure & Lifestyle: 5%
- - Media & Entertainment: 4%
- - Other Sectors: 18%
Download the Report


FINTRX provides comprehensive data intelligence on 850,000+ family office & investment advisor records, each designed to help you identify, access, and map the private wealth ecosystem. Explore in-depth dossiers on each family office & investment advisor. Access AUM, source of wealth, investment criteria, previous investment history, sectors & industries of interest and advisor growth signals, among other key data points.
Additionally, FINTRX provides insight and expansive contact information on 850,000+ decision-makers, featuring job titles, direct email addresses, phone numbers, common connections, alma maters, past employment history, brief bios & much more.
For an in-depth exploration of the FINTRX family office platform, request a demo below.


Written by: Renae Hatcher |
December 09, 2022
Renae Hatcher is a member of the marketing team at FINTRX - focused on delivering targeted & relevant family office and registered investment advisor content to our subscribers.
COMPANY
COMPARE US
FROM THE BLOG


Copyright © 2026 FINTRX, Inc. All Rights Reserved. 18 Shipyard Drive Suite 2C Hingham, MA 02043 Data Privacy Policy
.png?width=367&height=109&name=ezgif.com-gif-maker%20(3).png)