
RIA M&A Activity Report Q3 2026
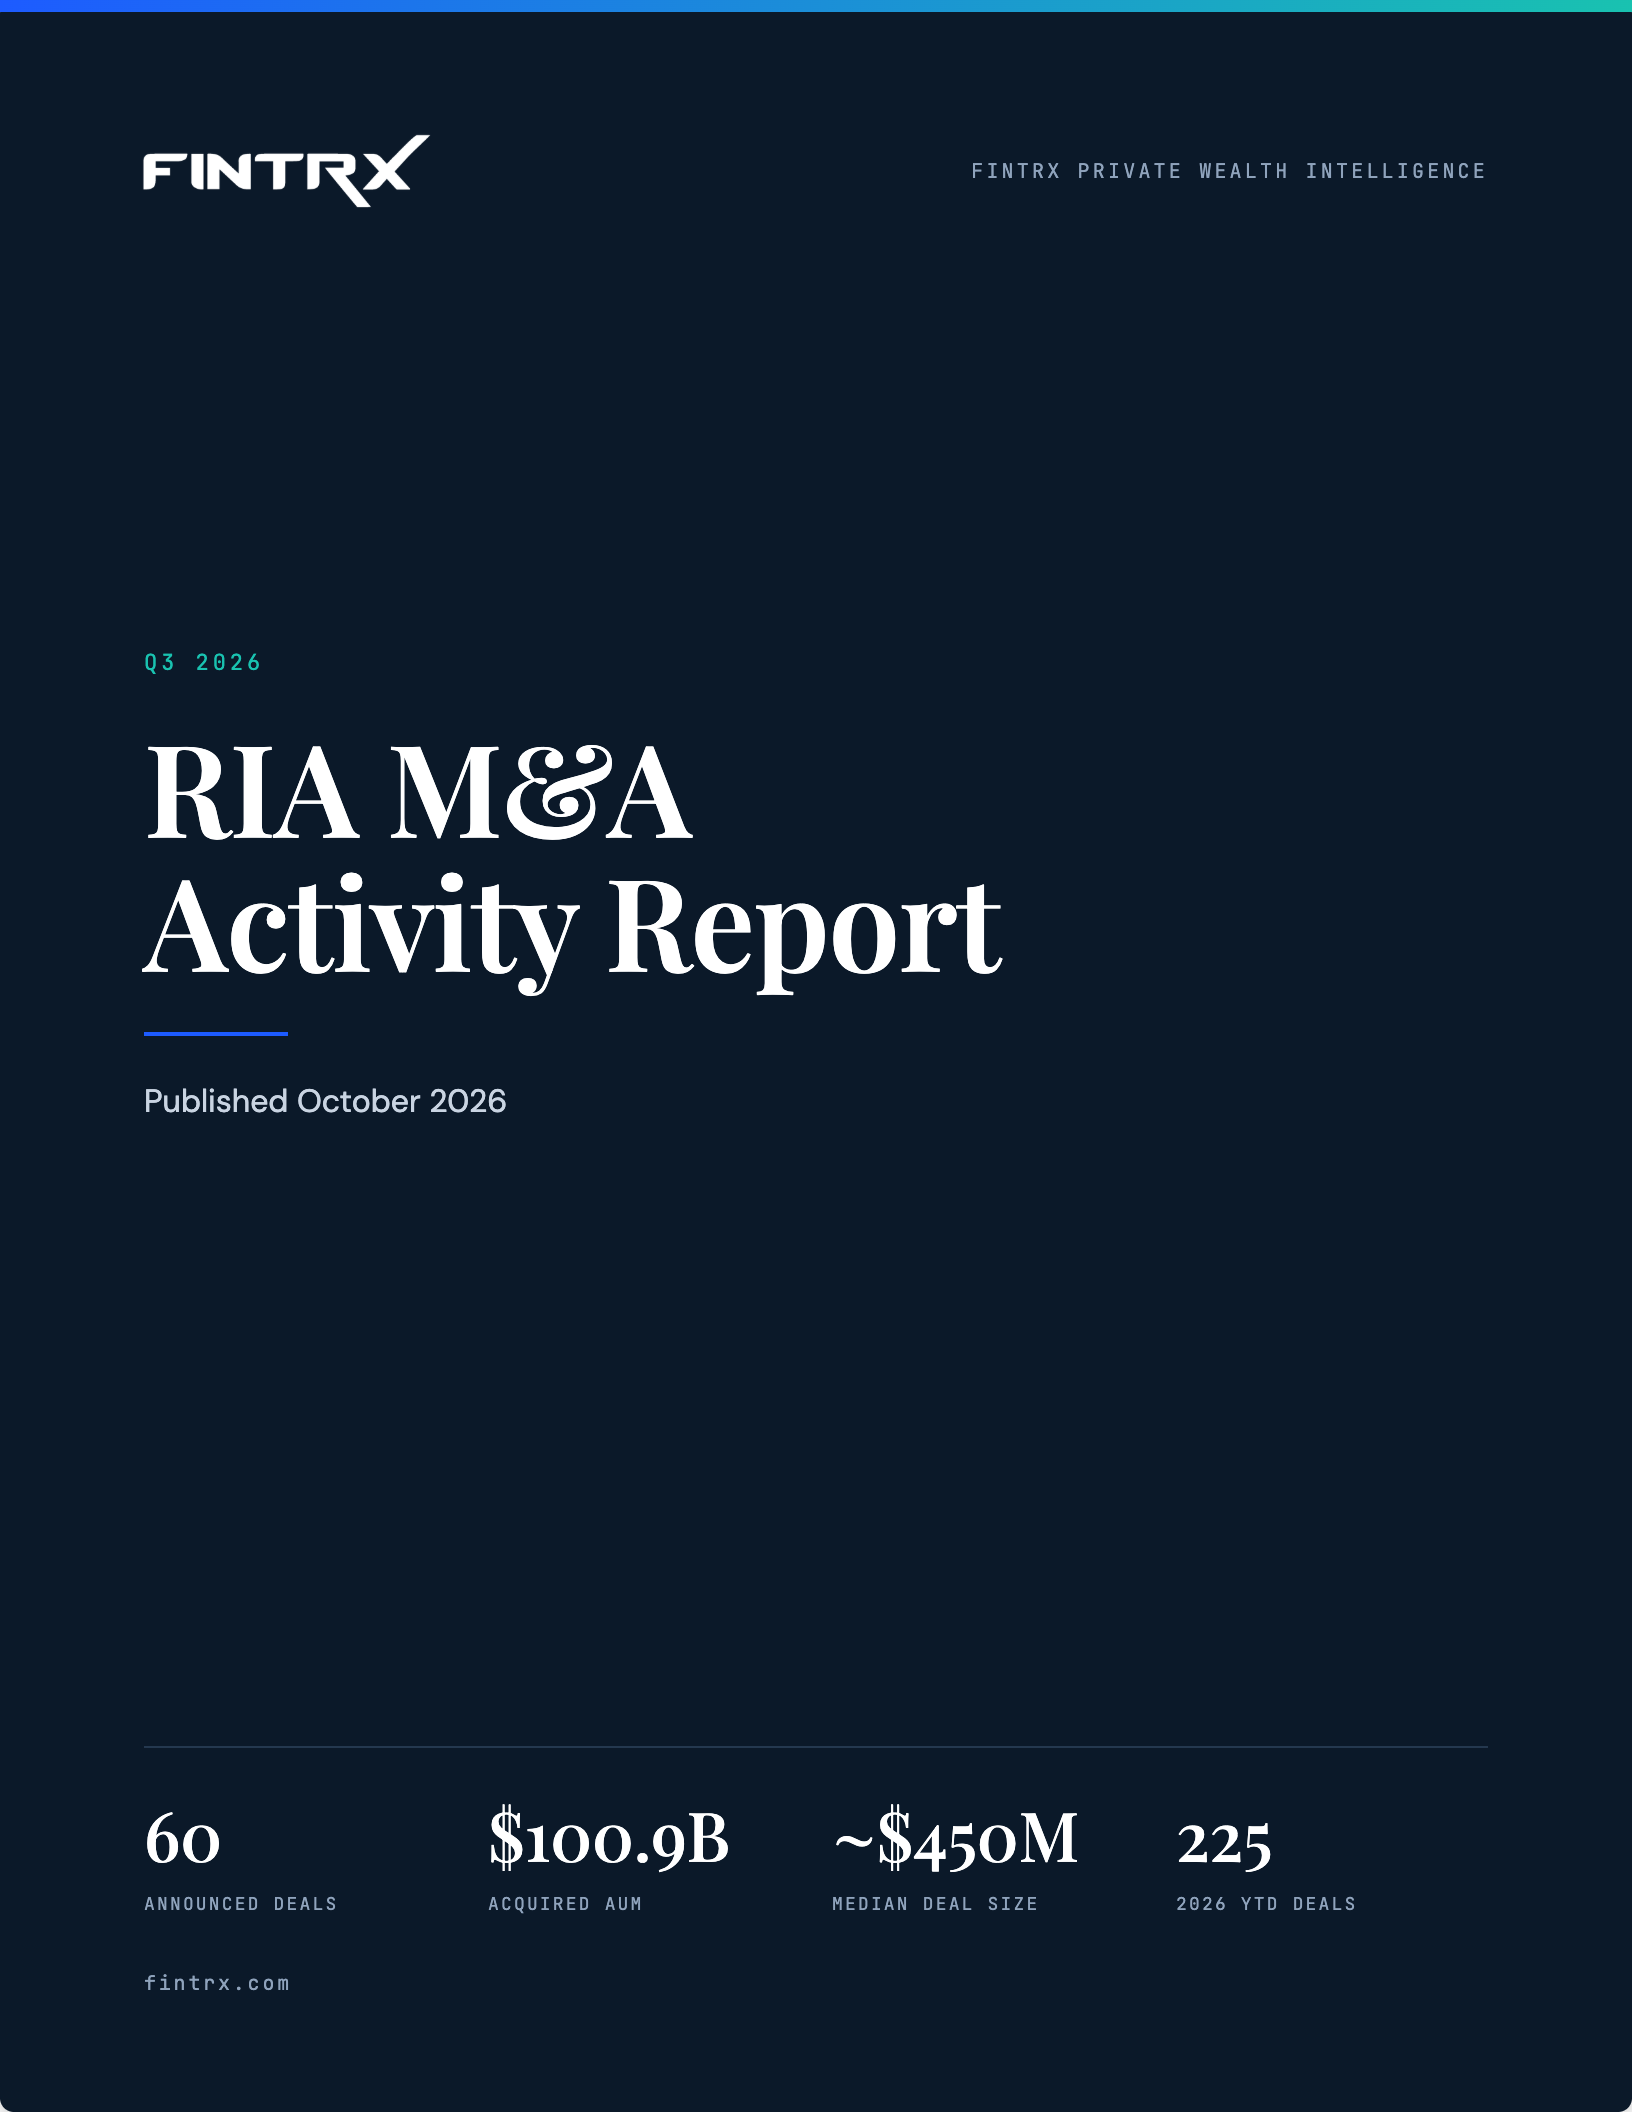
60 announced RIA-to-RIA transactions, $100.9B in acquired AUM, and six quarters of historical context, built from FINTRX proprietary transaction data.
More buyers, smaller targets, a handful of headline deals
- 01225 deals in 2026 to dateAnnounced through September, already surpassing all of 2025’s 193.
- 02Median deal size fell from ~$1.4B to ~$450MSince Q1 2025, as a broadening acquirer base targets smaller firms.
- 03Five deals made up 65% of Q3 AUMLed by Neos Investments ($30B) and Summit Trail Advisors ($21B).
- 04Wealth Enhancement led with 6 Q3 dealsAnd remains the most active acquirer since Q1 2025, with 21 transactions.
Q3 2026 Market Snapshot
Q3 2026 by Month
July led the quarter on deal count with 22 announced transactions. August produced the highest acquired AUM at $60.2B, driven by the Neos and Summit Trail transactions. September closed with 19 deals and the quarter’s highest median deal size at $564M: a month without a single headline outlier and a healthy baseline of mid-market activity.
Largest Deals of Q3 2026
- 1 Neos InvestmentsWestport, CT Acquired by Goldman Sachs Asset Management $30.0B
- 2 Summit Trail AdvisorsNew York, NY Acquired by Corient $21.0B
- 3 Spire Wealth ManagementMcLean, VA Acquired by Concurrent Investment Advisors $5.4B
- 4 Seven Bridges AdvisorsNew York, NY Acquired by Corient $4.9B
- 5 Good Life AdvisorsCelebration, FL Acquired by LPL Financial $4.4B
The five largest transactions accounted for approximately $65.7B, roughly 65% of total Q3 acquired AUM. That concentration is consistent with the broader 2026 pattern: a small number of transformative platform acquisitions sitting atop a large base of sub-$1B activity.
Most Active Acquirers: Q3 2026
Quarterly Deal Activity: Q1 2025 to Q3 2026
Deal volume grew from 26 transactions in Q1 2025 to a peak of 84 in Q1 2026. The 2026 YTD total through September stands at 225 announced transactions, already surpassing all of 2025’s 193 deals. Median deal size has compressed from ~$1.4B in early 2025 to ~$450M in Q3 2026, reflecting a broadening acquirer base targeting smaller firms. Early 2025 saw fewer transactions weighted toward large platform firms, keeping the median above $1B. Outsized deals also drove quarterly AUM: Fidelity Personal and Workplace Advisors ($819B, Q1 2025), Commonwealth Financial Network ($305B) and Monticello Associates ($124B, Q3 2025), Clark Capital Management ($30.6B, Q4 2025) and Pathway Capital Management ($95B, Q2 2026).
Top Acquirers: Q1 2025 to Q3 2026
What This Means for ETF Issuers and Asset Managers
Every acquisition is a commercial trigger event. When RIAs merge, advisors may move firms, investment platforms are reevaluated, product shelves change, new decision-makers emerge, and territories realign. Competitors may lose footing during integration.
Sixty transactions in Q3 alone, and 225 across 2026 to date, means hundreds of disruption events across the private wealth channel each year. The teams that move fastest on M&A intelligence will be best positioned before competitors do.
Smart distribution teams should track active acquirers gaining scale, advisor movement after deals, newly combined firms reviewing allocations, regions seeing elevated concentration, and buyers with growing enterprise influence.
What This Means for Acquisitive RIAs
The most active buyers in this dataset are running proactive, repeatable pipelines rather than waiting for banker-led opportunities. Firms seeking growth need better visibility into likely sellers, succession-risk firms, regional tuck-in targets, repeat buyer patterns, and competitor expansion activity.
The compression of median deal size to the $400–500M range signals that the market for sub-$1B acquisitions remains highly active and competitive. Firms that build systematic pipeline visibility will outperform those relying on reactive deal flow.
For growth-focused teams, M&A data is not just market news. It is revenue intelligence.
FINTRX is the leading private wealth intelligence platform, purpose-built for firms that need to find, understand, and engage with the registered investment advisor and family office channel. FINTRX covers RIAs, broker-dealers, wirehouses, private wealth teams, family offices, and endowments and foundations, giving asset managers, ETF issuers, alternative fund managers, and financial services firms the contact-level intelligence, allocation data, AUM tracking, and relationship mapping they need to move faster than their competition.
This report covers RIA-to-RIA M&A transactions tracked by FINTRX from Q1 2025 through Q3 2026. Both the acquiring and acquired firms are registered wealth management entities within the private wealth landscape. Financial acquirers, including private equity firms, banks, and insurers, are excluded from deal counts and AUM totals, though some transactions may involve firms with institutional backing that also hold RIA registrations.
FINTRX aggregates and validates transactions using public filings, regulatory sources, digital signals, market announcements, and proprietary research. Each transaction record includes acquired firm name, acquiring firm name, transaction date, AUM, employee count, headquarters location, and historical buyer activity.
Data compiled by FINTRX from publicly available sources and proprietary research. Provided for informational purposes only; not investment advice. Accuracy not guaranteed.
Turn RIA M&A activity into pipeline.
FINTRX helps firms track acquisitions, advisor movement, active buyers, likely sellers, and the commercial opportunities created across the private wealth market. Move faster on M&A signals. Capitalize on post-deal disruption before competitors do.